The Rewards Landscape in 2026: A System Under Pressure
When organizations invest in people with intention, they don’t just drive performance; they help people thrive – this underlying principle is core to workplace rewards. Employers today spend an average of $37 per hour worked, or roughly $77,000 on compensation per employee per year, making personnel one of the largest line items on company budgets.1 Beyond base pay, organizations also invest heavily in other rewards offerings. Nearly all offer variable pay (96%) and merit pay (93%),2 while 42% offer benefits such as health reimbursement arrangements. Investment in professional development is similarly widespread, with 84% offering formal learning opportunities and 78% providing coaching and mentoring,3 reflecting the vast scope and scale of rewards portfolios today.
Despite these substantial investments, employee engagement has fallen to 31%, its lowest level in a decade, with 8 million fewer engaged workers since 2020,4 and voluntary quits hold steady at roughly 3.2 million per month.5 This incurs significant costs, as unengaged employees account for approximately $1.9 trillion in lost productivity nationally,6-7 with the cost of replacing an individual employee ranging from a staggering 0.5x - 2x the employee’s salary.8-9
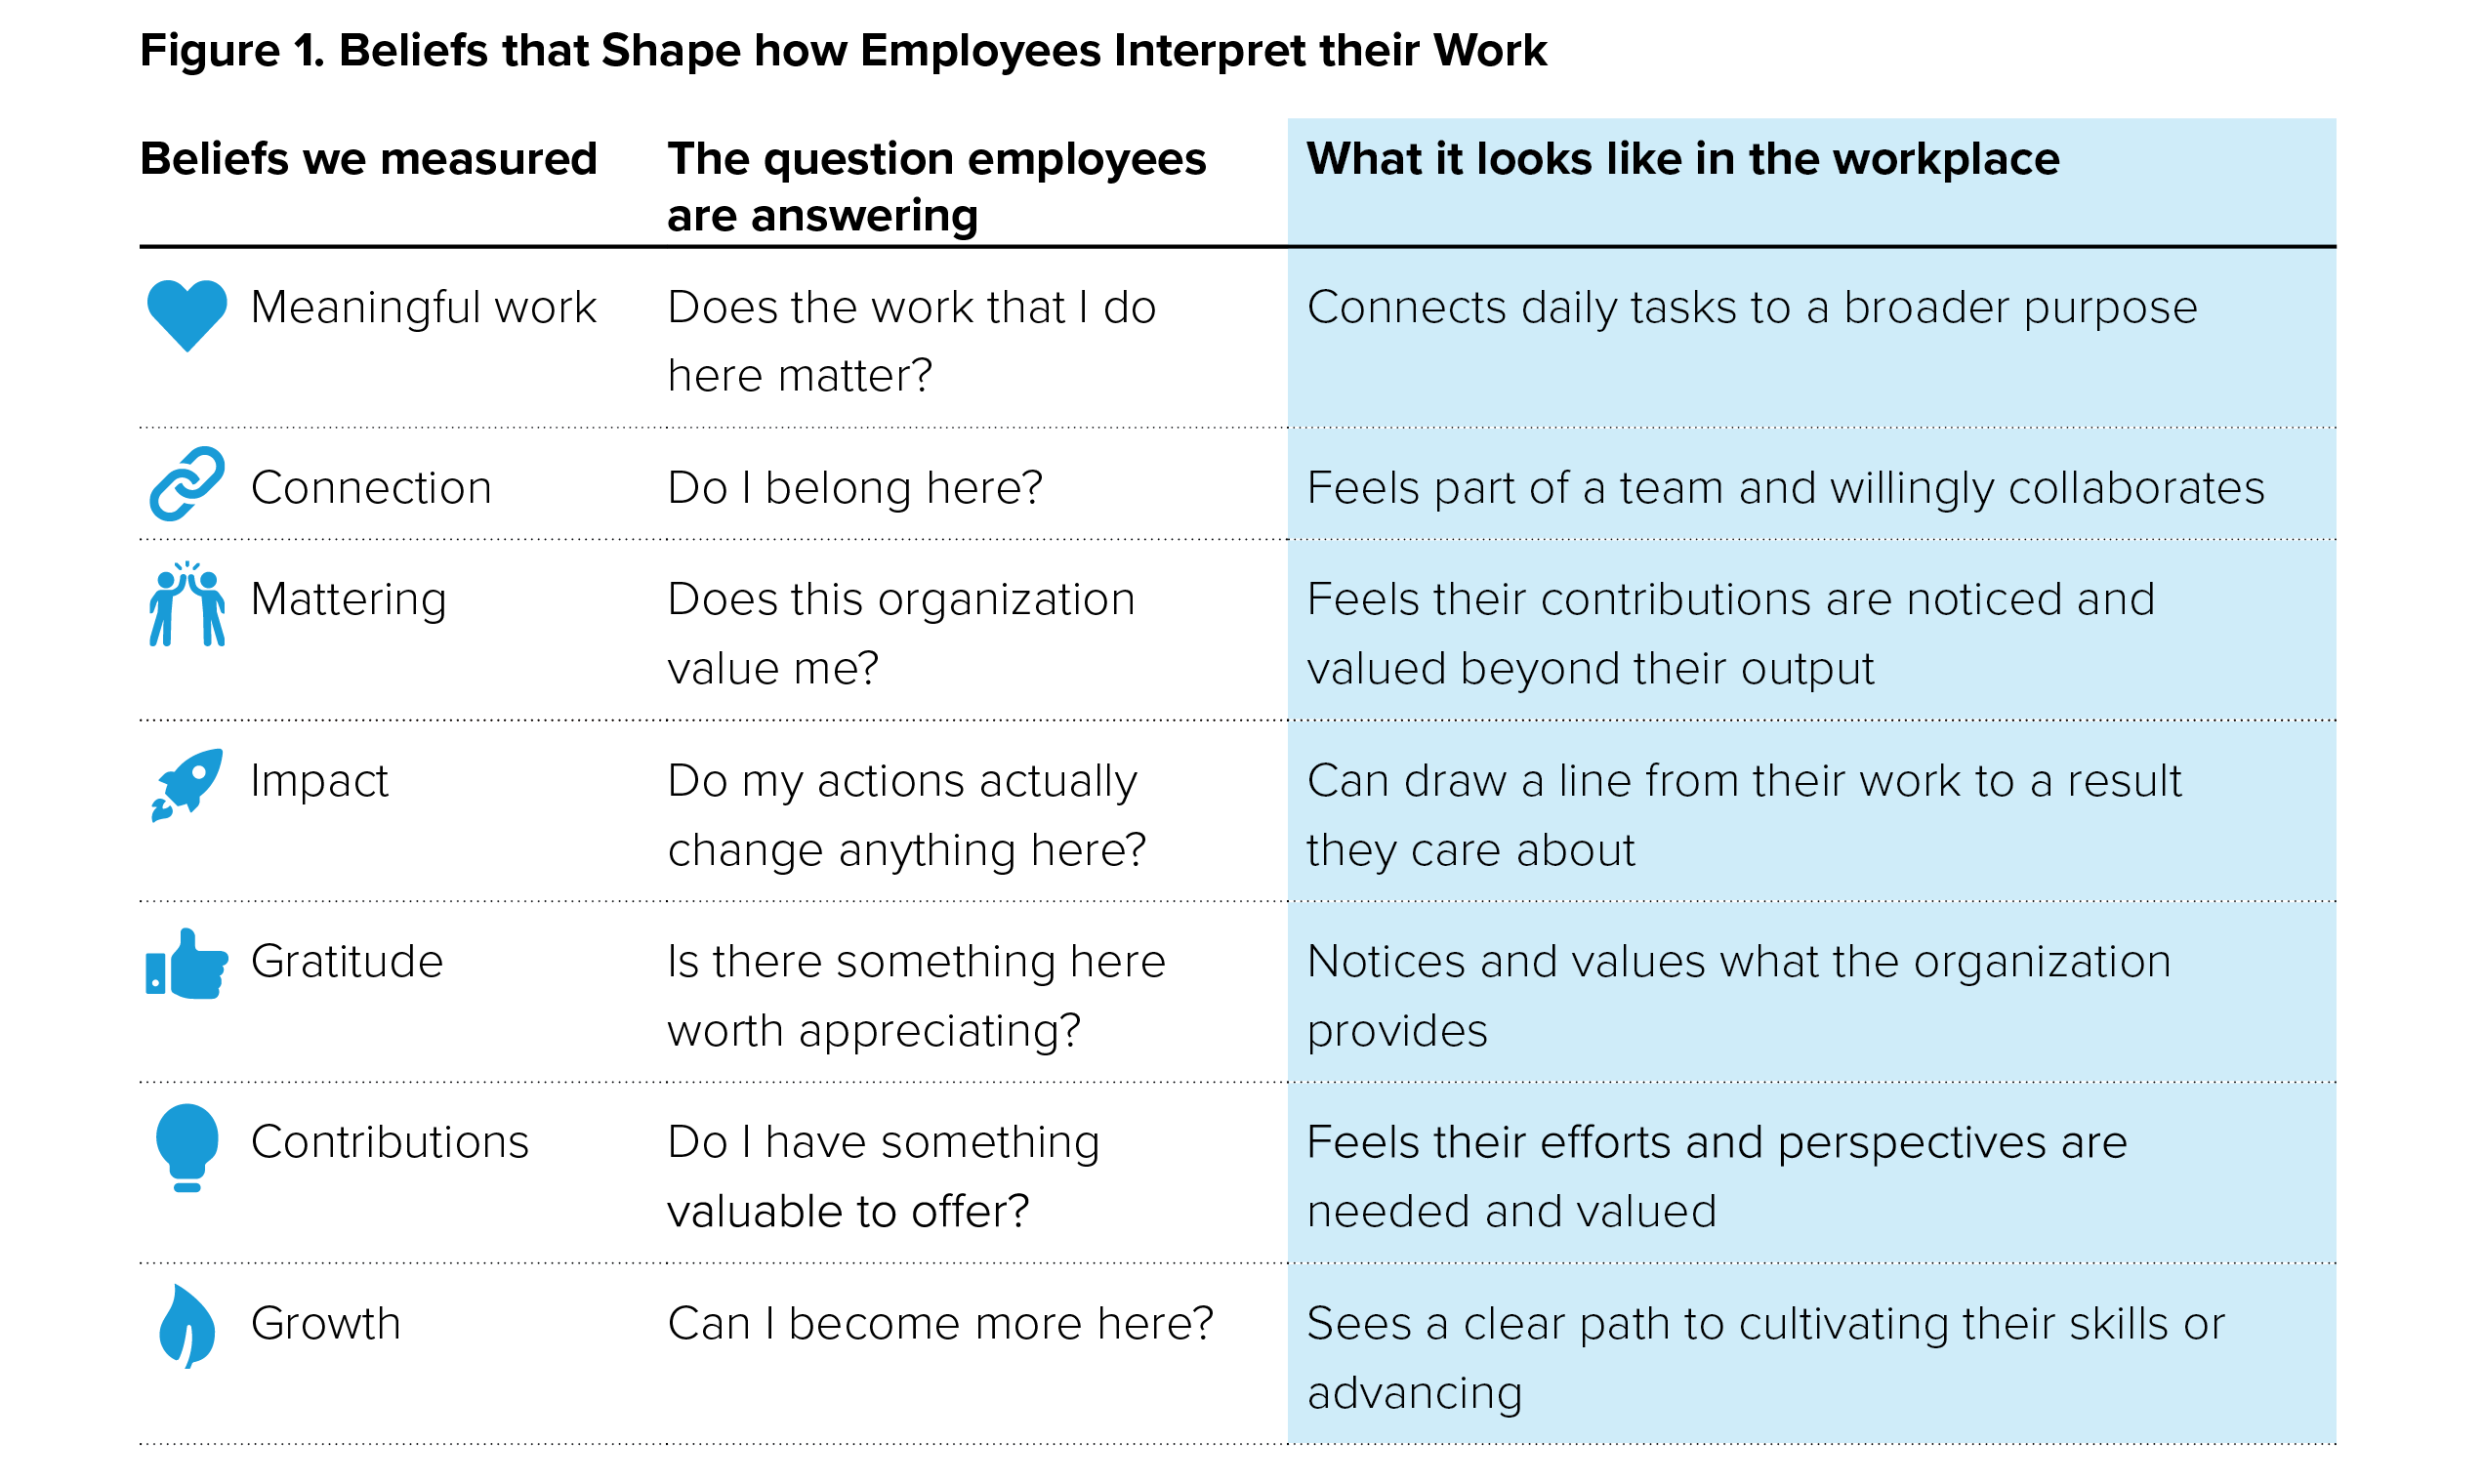
Taken together, these patterns highlight a significant opportunity to rethink rewards through a more intentional, human-centered approach one that elevates the employee value proposition across the career lifecycle and recognizes that the beliefs that individuals have about their work (for example, whether they find it meaningful, feel they matter, and see growth opportunities; see Figure 1) determine whether those rewards translate into optimal business outcomes.
Conducted in partnership with the Human Resources Certification Institute (HRCI) and the International Thought Leader Network (ITLN), this study sought to explore three core research questions: (1) which rewards employees value most across the employee lifecycle, (2) how employees’ core beliefs about their work (whether they find it meaningful, feel they matter, and see growth opportunities) shape those preferences and predict workforce outcomes, (3) where gaps may exist between employees’ reported values and the potential assumptions held by managers/leaders.
This study is anchored in the WorldatWork Rewards framework, encompassing well-being, recognition, career growth, compensation, and benefits, treating these five pillars not as isolated elements but as an interconnected ecosystem whose combined effect delivers the highest value for organizations. Our research surfaces an underlying misalignment at the core of this employee value proposition, operating across three key mechanisms:
- The first is the rewards – lifecycle gap. The rewards that initially attract candidates to a job are often not the same rewards that drive their engagement or decision to stay in the job as they advance across their careers and life stages, yet many organizations treat these as static offerings.
- The second is an employee preference/manager perception gap. Managers’ perceptions of what employees actually value in the workplace may not always align with employees’ preferences, especially as they evolve across different career and life stages.
- Finally, we find that employees’ beliefs about their work (whether they find it meaningful, feel they matter, and see growth opportunities), are critical drivers for longer-term retention, engagement, and satisfaction. While compensation and benefits remain important for attracting talent, their ability to sustain these outcomes depends in part on whether this belief layer is intact.
The 2026 State of Rewards aims to close these enduring gaps. By capturing employee experiences and preferences across the full lifecycle, comparing them with leader perceptions, and how core beliefs about work (Figure 1) shape the effectiveness of the entire rewards portfolio, this study offers leaders the evidence-based clarity and actionable insights to strategically structure a rewards portfolio that enables them to fully realize the potential of their evolving workforce needs.
Executive Summary
The Rewards Paradox
- Employee satisfaction with foundational rewards is reasonably strong: benefits (77%), well-being (73%), compensation (69%), yet only 44% of employees report being extremely likely to stay with their employer in the next year.
- Job exploration is widespread: Among employees considering leaving, three‑fourths have searched for external jobs, about half have applied, and 38% have interviewed elsewhere.
- Employees are relatively satisfied with the compensation and benefits they receive, yet many are actively preparing to leave, suggesting that satisfaction with these factors alone is not sufficient for longer-term retention.
What Attracts Employees Is Not What Retains Them
- For employees, competitive pay is table stakes across the lifecycle — important for attraction (88%), engagement (87%), and retention (93%) — but it does not explain variation in who stays and who leaves.
- When forced to prioritize, employees rank pay (70%), flexibility (60%), benefits (40%), and meaningful work (36%) as the top factors in their decision to stay; meaningful work emerges as the differentiator once baseline expectations for pay and flexibility are met.
The Employee – Manager Perception Gap
- Managers correctly identify competitive pay as the top retention driver for their employees but misjudge the rewards components. They overestimate career advancement by 15 percentage points and underestimate flexibility (–14 pp), benefits (–8 pp), and PTO (–6 pp). While employees prioritize flexibility, benefits, and time off, managers think their employees want career advancement.
- Despite this misalignment, almost 7 in 10 managers report being extremely or very confident in their understanding of what employees value.
- Managers report the lowest eNPS of any role level (23.2% promoters) and weaker satisfaction across career development, recognition, and compensation.
How Rewards and Beliefs Impact the Bottom Line
- The workforce segment most responsible for delivering the rewards experience is itself the least satisfied and least likely to advocate for the organization. The rewards components with the highest satisfaction scores – compensation and benefits – are the weakest predictors of retention, whereas the rewards with the lowest satisfaction – career development and recognition – are the strongest.
- The same pattern holds for eNPS – well‑being, career development, and recognition are the strongest drivers of eNPS.
- Employees’ core beliefs about their work (e.g., whether they find it meaningful, feel they matter, and see opportunities to grow) shape how employees evaluate rewards. High‑belief employees rank meaningful work above pay as a retention factor; low-belief employees flip this order.
Detailed Findings
Rewards Paradox: Employees are relatively satisfied with benefits and compensation, yet many are considering leaving.
Across roles and responsibilities, employees report generally strong satisfaction with their rewards — ranging from 51% satisfied with career development up to 77% for benefits. On the surface, these numbers suggest that most organizations are delivering rewards packages that meet employee expectations.
But a closer look tells a deeper pattern. While top-line satisfaction is strong, there is considerable variation across pillars. Career development and recognition stand out, with almost a third of employees (30%) reporting neutral satisfaction with career development, and 28% are neutral on recognition. While neutral ratings are not dissatisfaction, they are not endorsement either, and they suggest a gap between headline satisfaction scores and how employees actually experience these rewards day-to-day.
That gap becomes sharper when satisfaction is examined alongside retention intent. Only 44% of employees report being extremely likely to stay with their employer in the next year, despite reporting strong satisfaction with most rewards categories. Employees with weaker retention intent also report higher dissatisfaction across the board. The connection between rewards satisfaction and commitment to stay is expected, but the fact that strong satisfaction coexists with soft retention intent points to something that satisfaction scores alone are not capturing.
These satisfaction patterns take on added weight when paired with employees’ reported experiences of career progression. Almost half (46%) say their organization does not invest in their growth as a professional, and another 55% report that the skill development opportunities available to them are not relevant to the work they do. Together, these findings connect low satisfaction with career development to a broader pattern of limited organizational investment in employee growth, with direct implications for retention.
Given strong overall satisfaction scores, one might expect employees to also be strong advocates for their organization, but they are not. Promoters (36%), passives (35%), and detractors (28%) are nearly evenly split, with a mean eNPS score of 2.1, suggesting that satisfaction with rewards is not translating into enthusiasm for the organization.
This lukewarm advocacy is consistent with employee behaviors; job exploration is widespread, with 75% of those considering leaving having searched for external jobs, 52% having applied, and 38% having interviewed elsewhere.
These findings reinforce a consistent pattern: organizations are investing heavily in rewards, yet workforce stability remains fragile, a dynamic well-documented in broader research findings.10-11
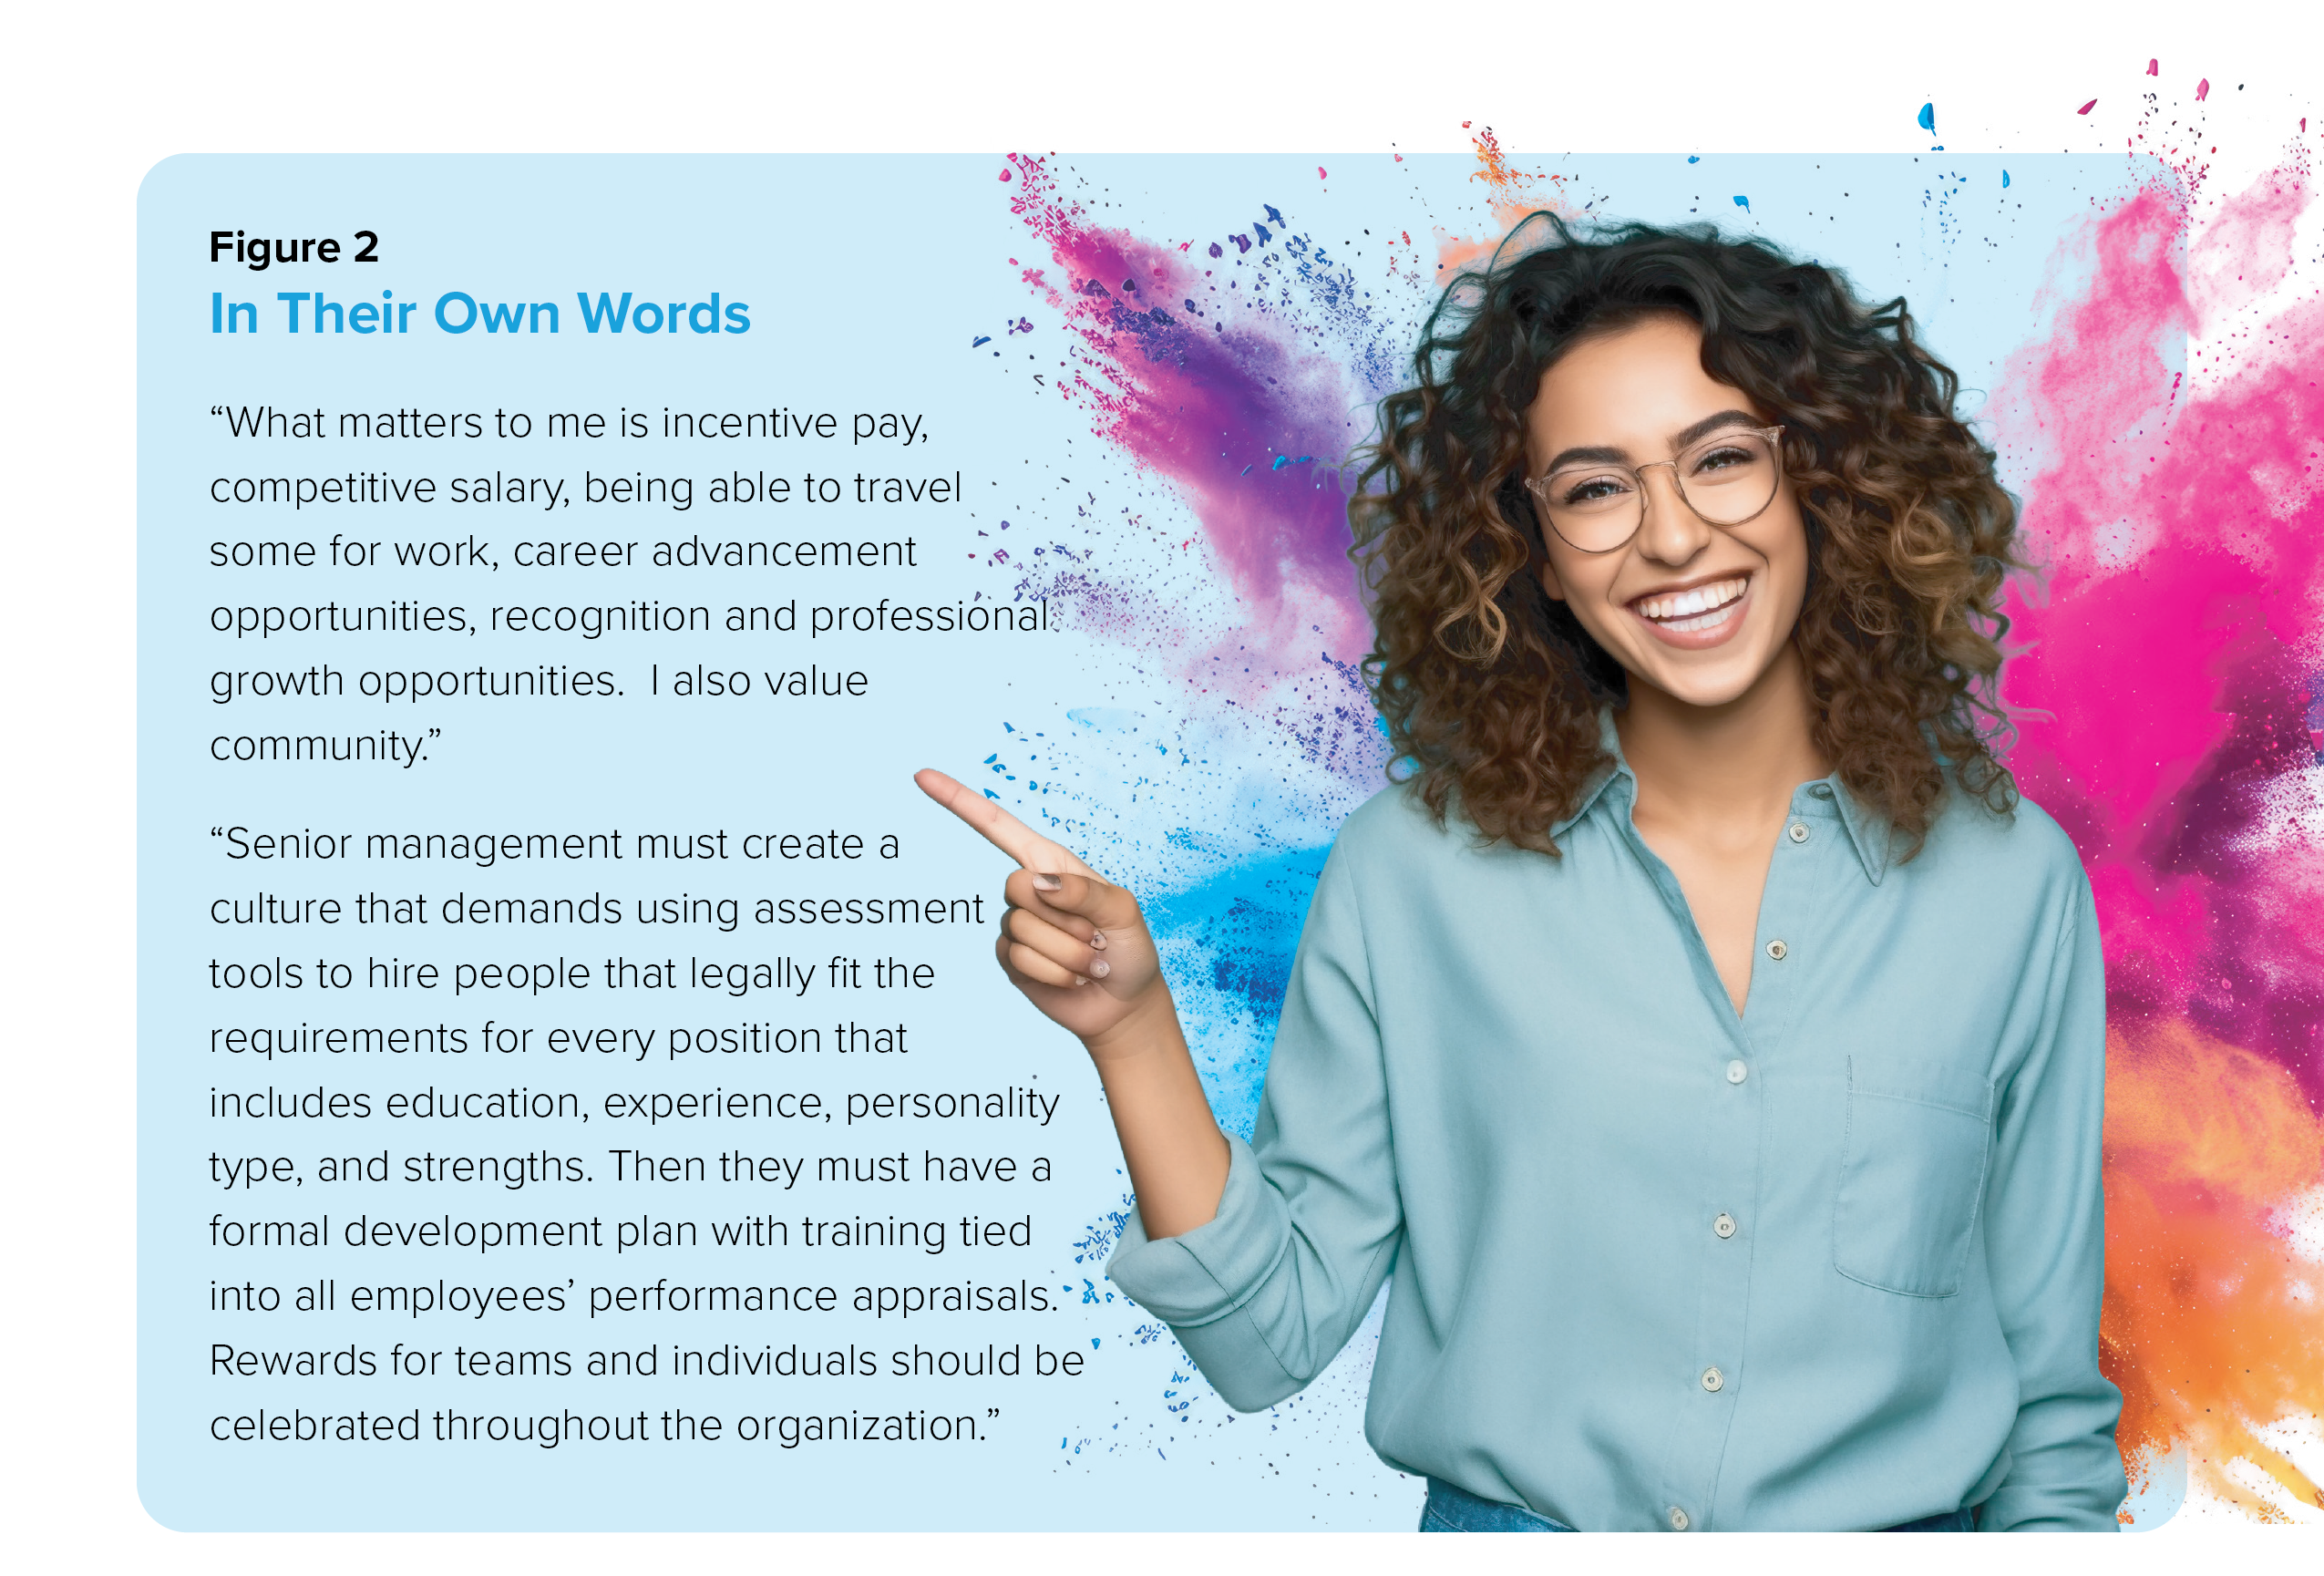
Employees’ own words add nuance to this dynamic. When asked what makes a great workplace or what matters most at work, respondents pointed to both foundational elements — competitive compensation and well-structured rewards — and to the less tangible but equally important factors: meaningful connections, opportunities for growth, and a sense that staying is worth more than just a paycheck (see Figure 2).
What attracts employees are not what retains them: Compensation attracts; flexibility sustains; meaningful work differentiates.
A common assumption, and one this study set out to test, is that what attracts employees to an organization is not necessarily what keeps them over time. To explore this, the survey examined how the importance of different rewards factors shifts across three stages of the employee lifecycle: attraction, engagement, and retention.
Competitive base pay remains consistently important throughout — rated highly for joining (87.6%), staying engaged (87%), and long-term retention (92.8%). Beyond pay, however, the pattern shifts. Work flexibility grows sharply across the lifecycle, rising from 68% at attraction to 85% for engagement and 88% for retention, making it one of the fastest-accelerating drivers in the findings.
Meaningful work follows a different pattern — it emerges as a top factor only after baseline expectations for pay and flexibility are met, suggesting that once foundational needs are secured, employees begin weighing whether the work itself gives them a reason to stay. When forced to choose their top three factors for staying long-term, employees rank them as follows: pay (70%), flexibility (60%), benefits (40%), and meaningful work (36%).
People leaders misdiagnose what their employees value
Managers and employees are closely aligned on the top two rewards that drive retention (competitive pay and flexibility), but their priorities diverge on the remaining rewards. When asked to identify the top rewards that drive long term retention for their employees, managers rank competitive pay as the top factor (77%), consistent with what employees also report (70%). But perception gaps emerge when it comes to career advancement, flexibility, benefits, and paid time off.
While employees value sustainability when delivered through rewards including work flexibility (60%), benefits (40%), and paid time off (31%), managers emphasize career trajectory, with almost 4 in 10 reporting career advancement is a top driver for employees, compared to just 1 in 5 employees actually prioritizing this reward. This 15 percentage point discrepancy is the single largest gap in the findings.
Managers also underestimate the importance of flexibility (-14 pp), benefits(-8pp), and paid time off (-6pp), suggesting that managers emphasize the reward components that employees should value – professional development, mobility, and growth, rather than the ones that actually matter for them.
Despite these gaps, most managers are confident in understanding what their employees value. Nearly 7 in 10 (68%) report being extremely or very confident in their understanding of what employees value, and only 2.5% acknowledge low confidence. The implication is that managers are not uncertain, but that they are confidently miscalibrated. The feedback loops that would allow them to see the gap and correct course are either absent or producing misleading signals. This matters because managers are the primary channel through which rewards strategy reaches employees.
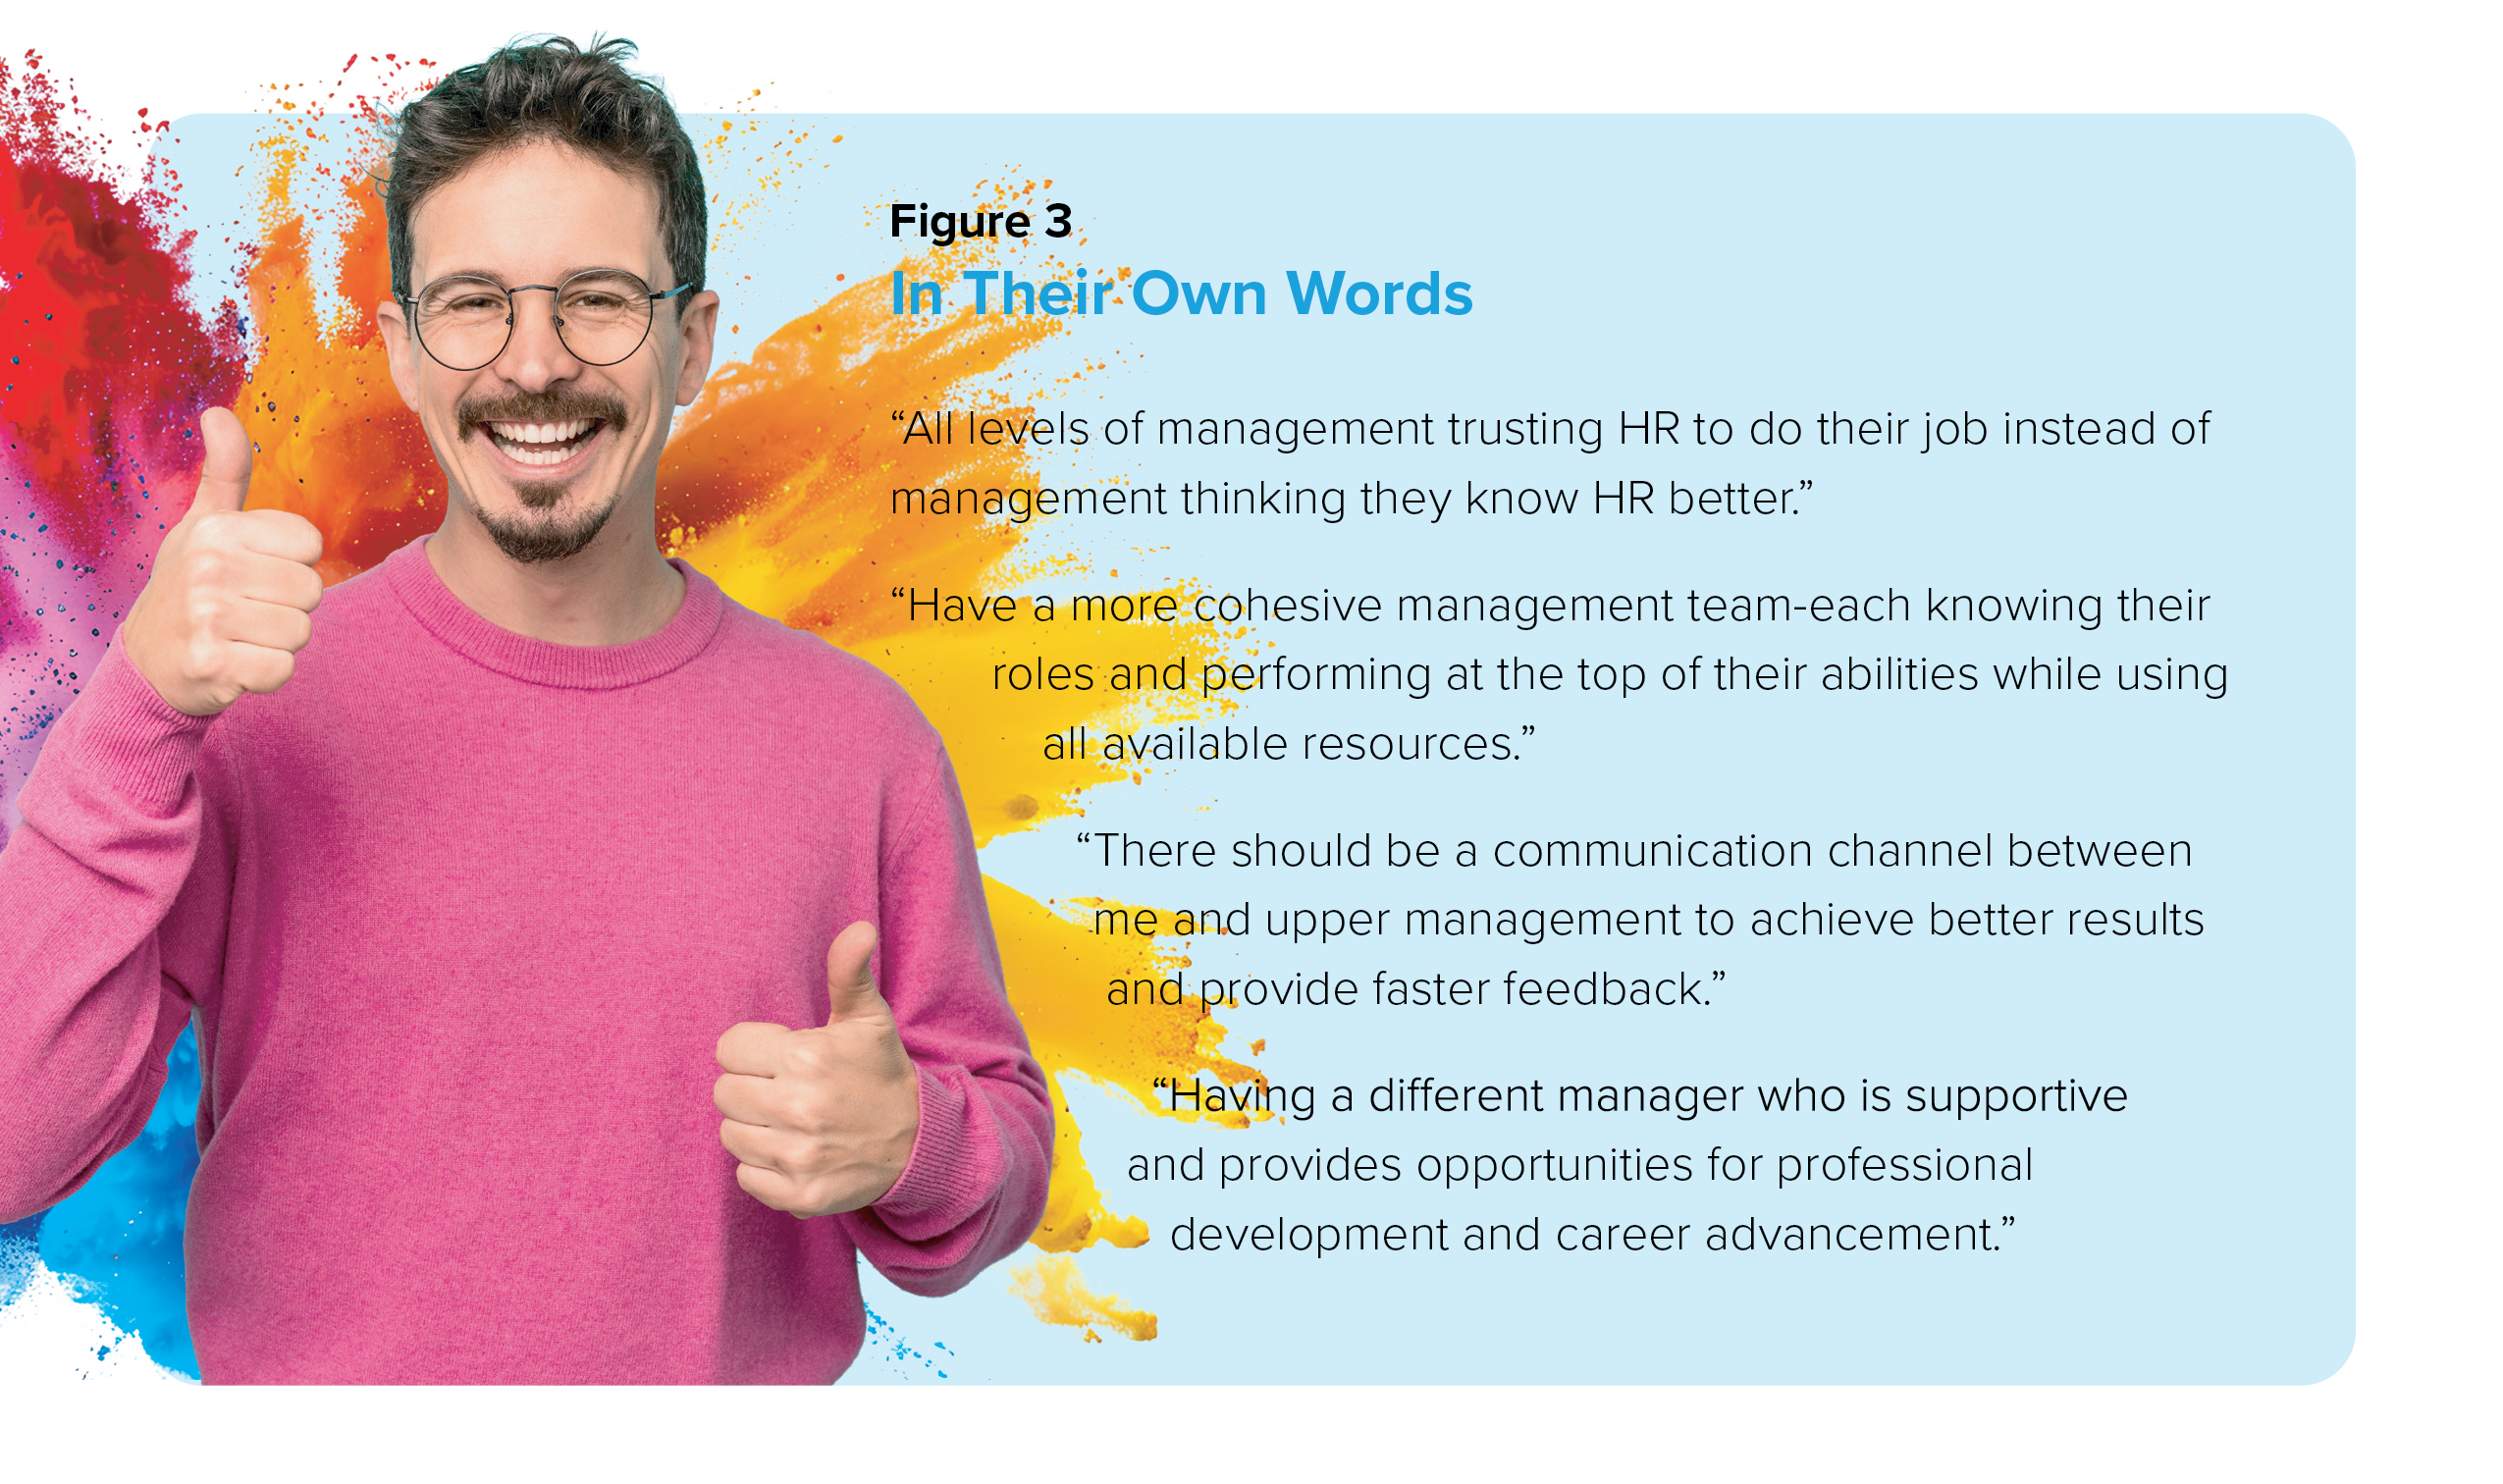
Employees’ own responses reinforce this pattern. When asked what single change would have the greatest impact on their job satisfaction, a consistent theme emerged: the desire for management built on trust, communication, and support (see Figure 3).
The challenge runs deeper than perception. Consistent with existing research,12-15 managers report weaker satisfaction across compensation, recognition, and career development, and are the least likely to be NPS promoters, compared to individual contributors, directors, and VP level respondents. This may present a challenge for organizations, as the group responsible for implementing organizational rewards strategy into daily employee experiences are themselves among the least satisfied and least likely to recommend their respective organizations. When this implementation layer is strained, even well-designed rewards strategies lose fidelity before they reach the employees they are intended to serve.
Closing the perception gap therefore requires building the structural feedback mechanisms that allow managers to have clarity into what their employees actually value, while simultaneously investing in the manager experience itself so that they are positioned to effectively support and deliver the rewards portfolio.
The rewards that predict retention/employee advocacy and how beliefs shape these outcomes
When looking at satisfaction ratings across the five rewards pillars, employees report high satisfaction with foundational rewards such as benefits (77%), well-being (73%), and compensation (69%), but lower levels of satisfaction for recognition (58%) and career development (50%). A regression analysis demonstrates that these satisfaction rankings invert when it comes to predicting retention.
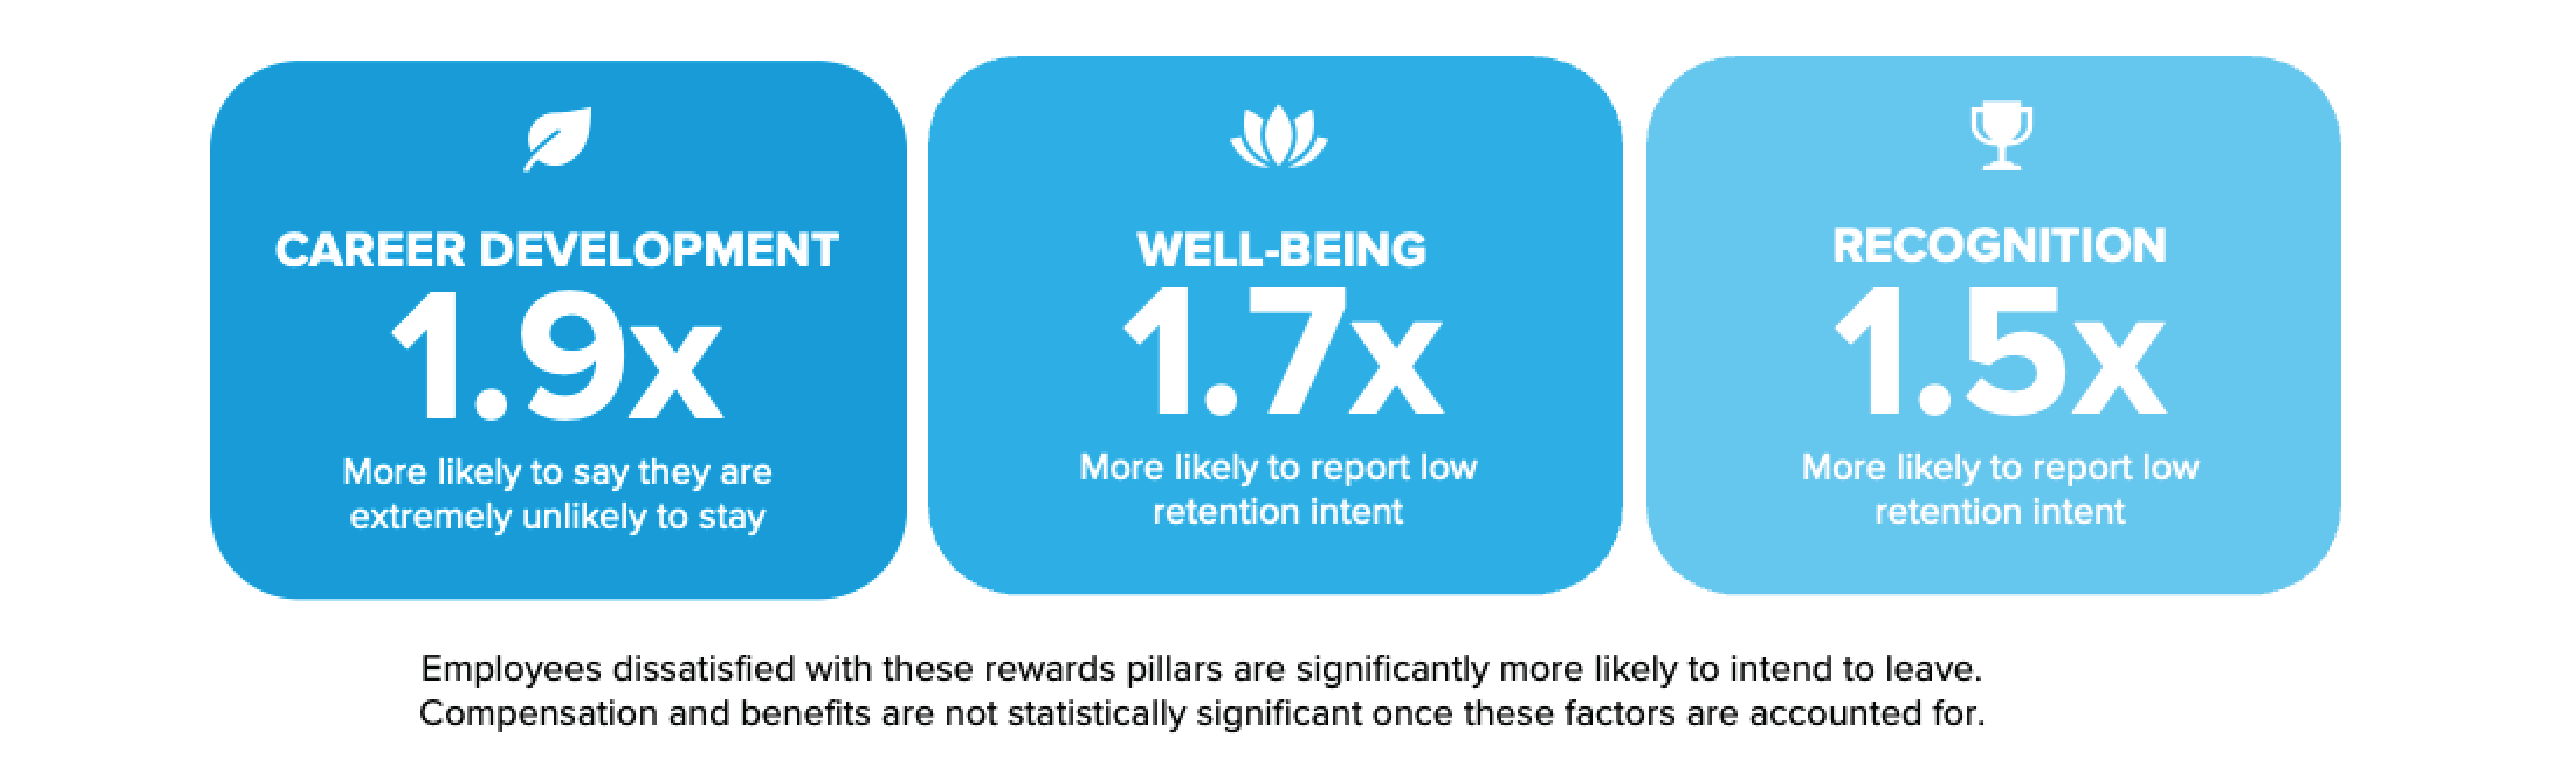
The pillars with the highest satisfaction scores – compensation and benefits – are the weakest predictors of whether employees intend to stay, and the pillars with the lowest satisfaction scores – recognition and career development – are the strongest predictors. Employees dissatisfied with career development are ~1.9x times more likely to say they are extremely unlikely to stay, those dissatisfied with well-being are ~1.7x more likely to report low retention intent, and those with low satisfaction with recognition are ~1.5x more likely to report low retention intent. And while it’s broadly known in the research landscape that organizations who offer robust career development opportunities have higher rates of engaged learners and job promotions, manager support lags these aspirations.
For instance, recent research has shown that only 15% of employees say their manager helped them build a career plan, while almost half say a lack of good career advice has hurt their job trajectory.16-17 Yet even as career development emerges as the strongest retention predictor, the rewards pillars that have historically received the most investment tell a different story. Compensation and benefits appear to function as table stakes; their absence creates dissatisfaction, but their presence does not differentiate employees who are committed from those wanting to leave.
The same trends are reflected for employee advocacy, with well-being, career development, and recognition driving higher eNPS scores, suggesting that employees become advocates not only due to compensation and benefits, but because their daily experience of recognition, growth, and support offers them something worth advocating for. These findings establish which rewards pillars predict retention and advocacy, but they raise a deeper question — if the same programs are available to all employees, why do some experience them as sufficient, while others don’t?
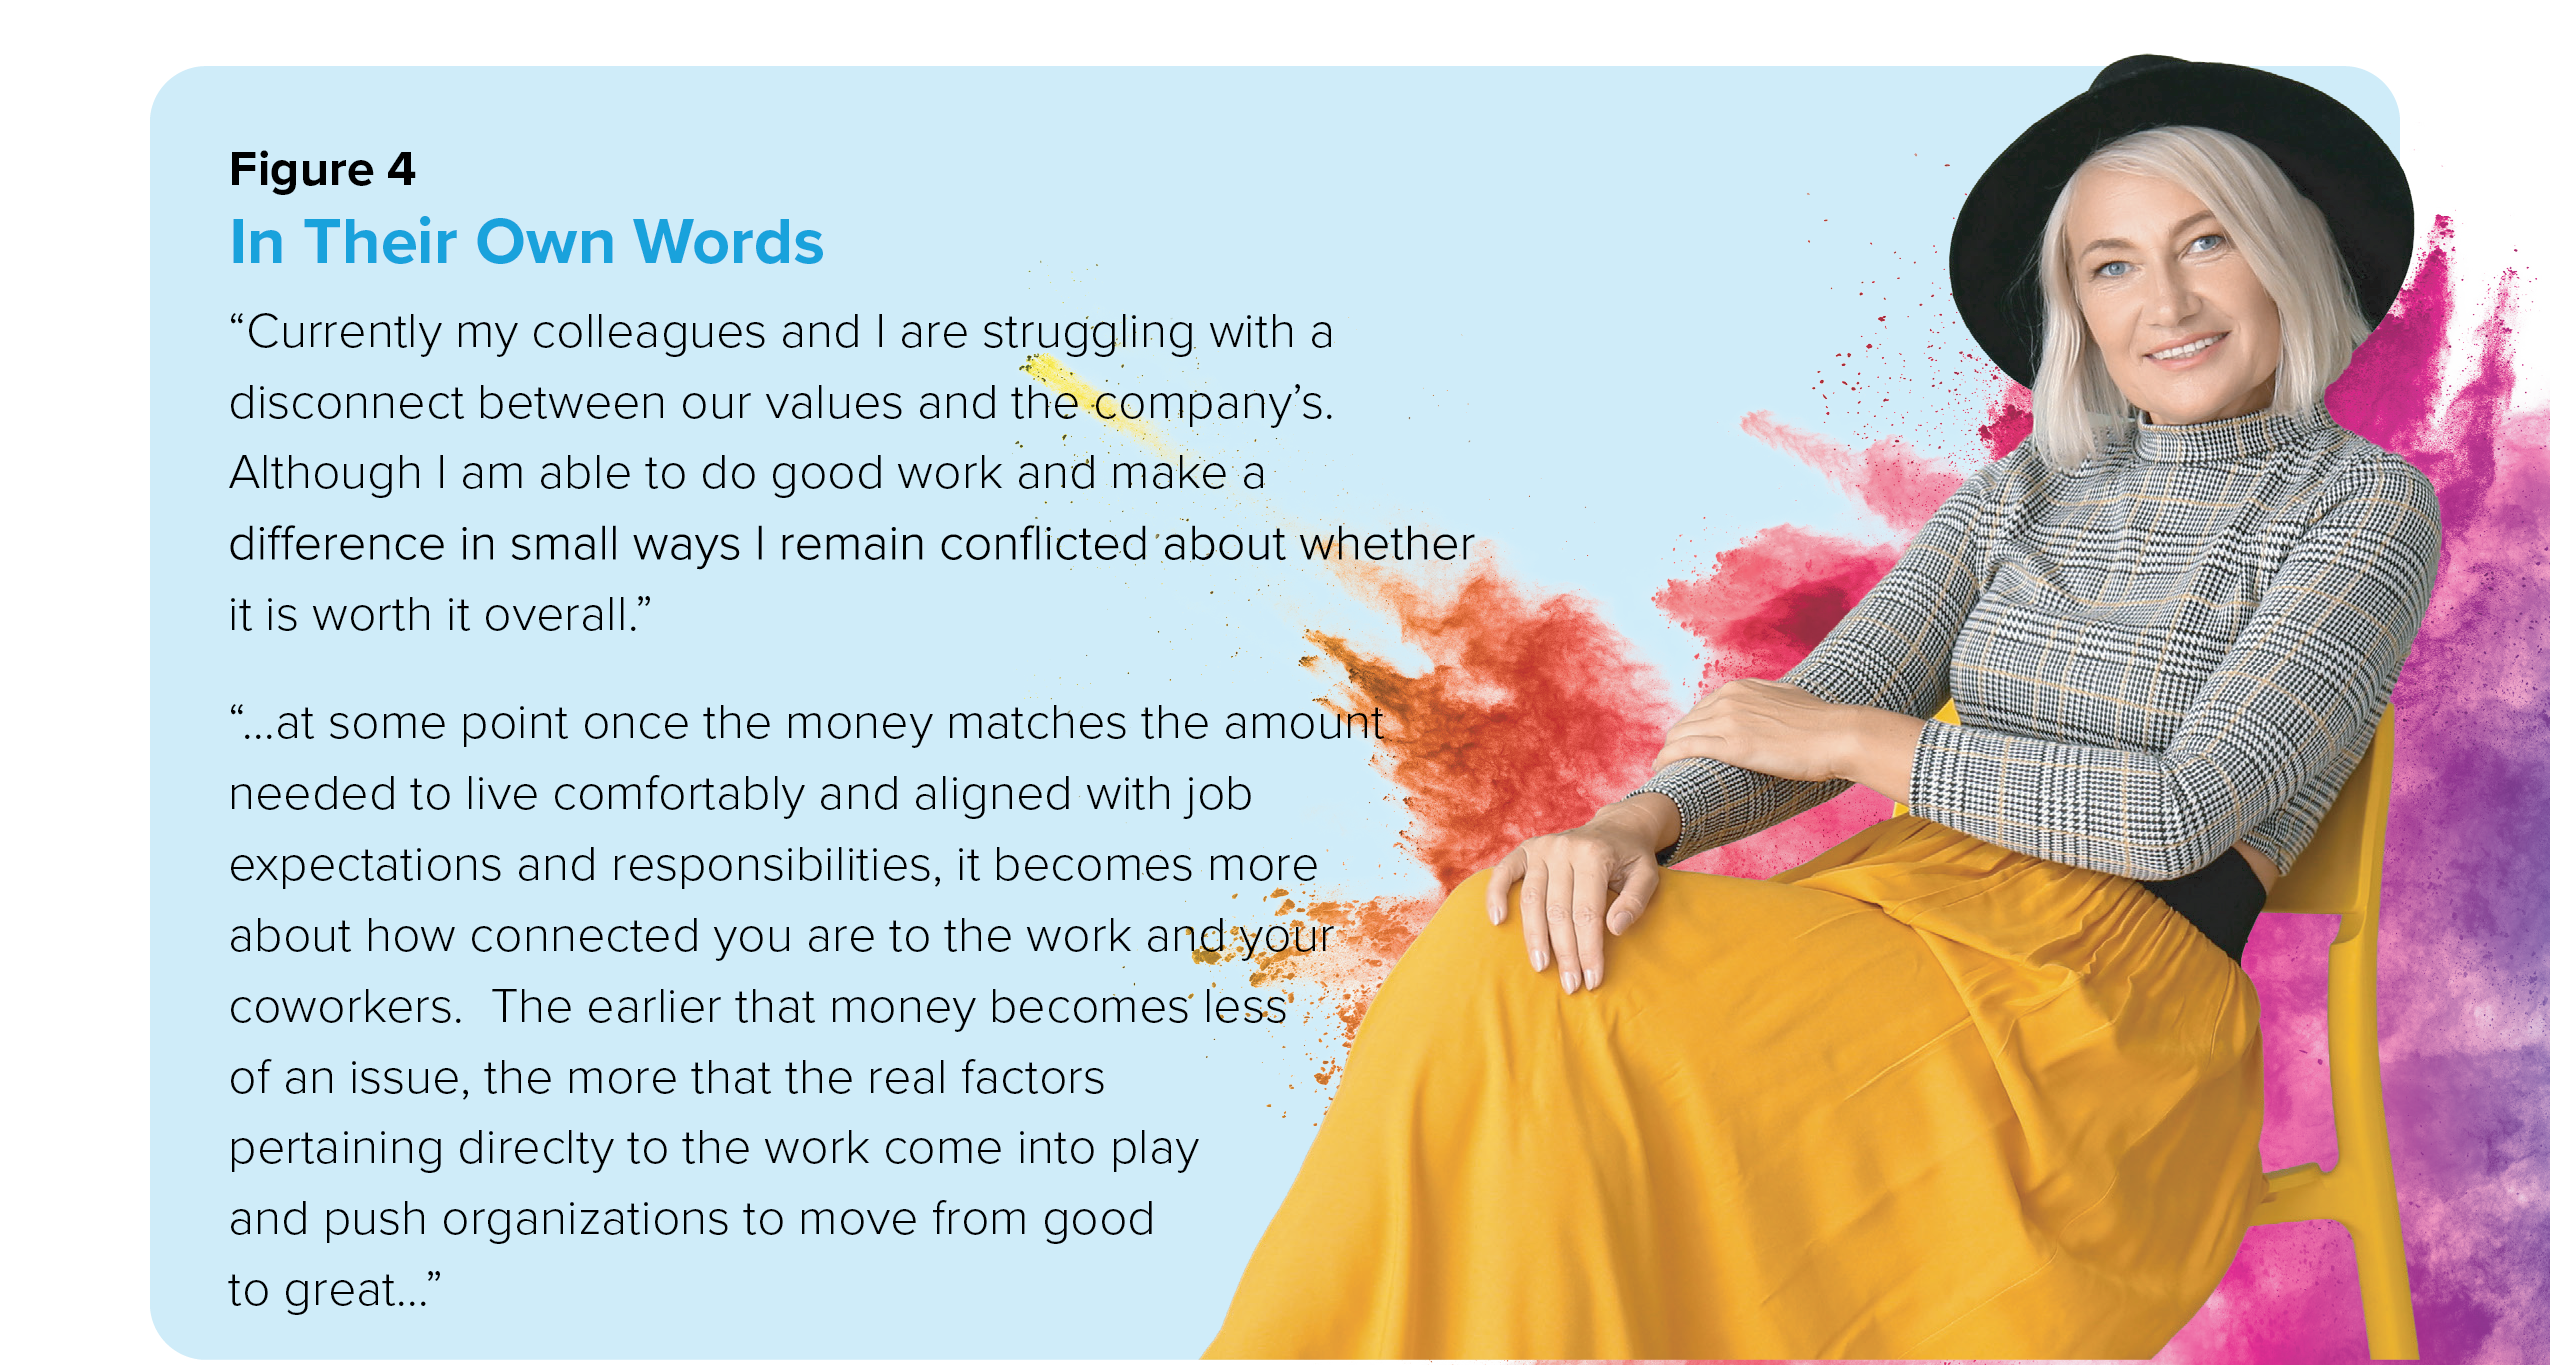
Employees’ own responses offer some additional nuances to this insight. When asked what makes a great workplace or what matters most to them at work, a consistent theme emerged — the degree to which the values of employees align with those of the organization, and role that connection and belonging play in shaping whether their rewards feel sufficient (see Figure 4). The ways through which different employees experience the rewards components can vary depending on the beliefs that they have about their work (for example, whether they find it meaningful, feel they matter, and see growth opportunities (Figure 4). These beliefs function as the lens through which every reward is interpreted.
When that lens is robust, the same programs generate stronger outcomes. High-belief employees report an average eNPS score of 8.84 compared to 5.36 for low-belief employees, and the same pattern holds for retention intent.
Beliefs also reshape what employees say they need. Those with stronger beliefs rank meaningful work above competitive pay as a retention driver. Those with weaker beliefs flip the order and pay becomes the primary anchor. This suggests that when meaning, mattering, and growth are absent from the work experience, compensation becomes the only remaining factor employees can evaluate. High-belief employees are also more satisfied with every rewards category, even though they receive the same programs. The gap is largest for career development (+1.33 points) and recognition (+1.21), and smallest for benefits (+0.62). This is consistent with established research showing that positive beliefs drive performance outcomes and not the other way around.18-20
The same rewards portfolio generates different returns depending on the belief state of the employee receiving it. And the effect is strongest on rewards that depend on human interaction — manager feedback, growth conversations, recognition — rather than on rewards delivered through policies and systems.
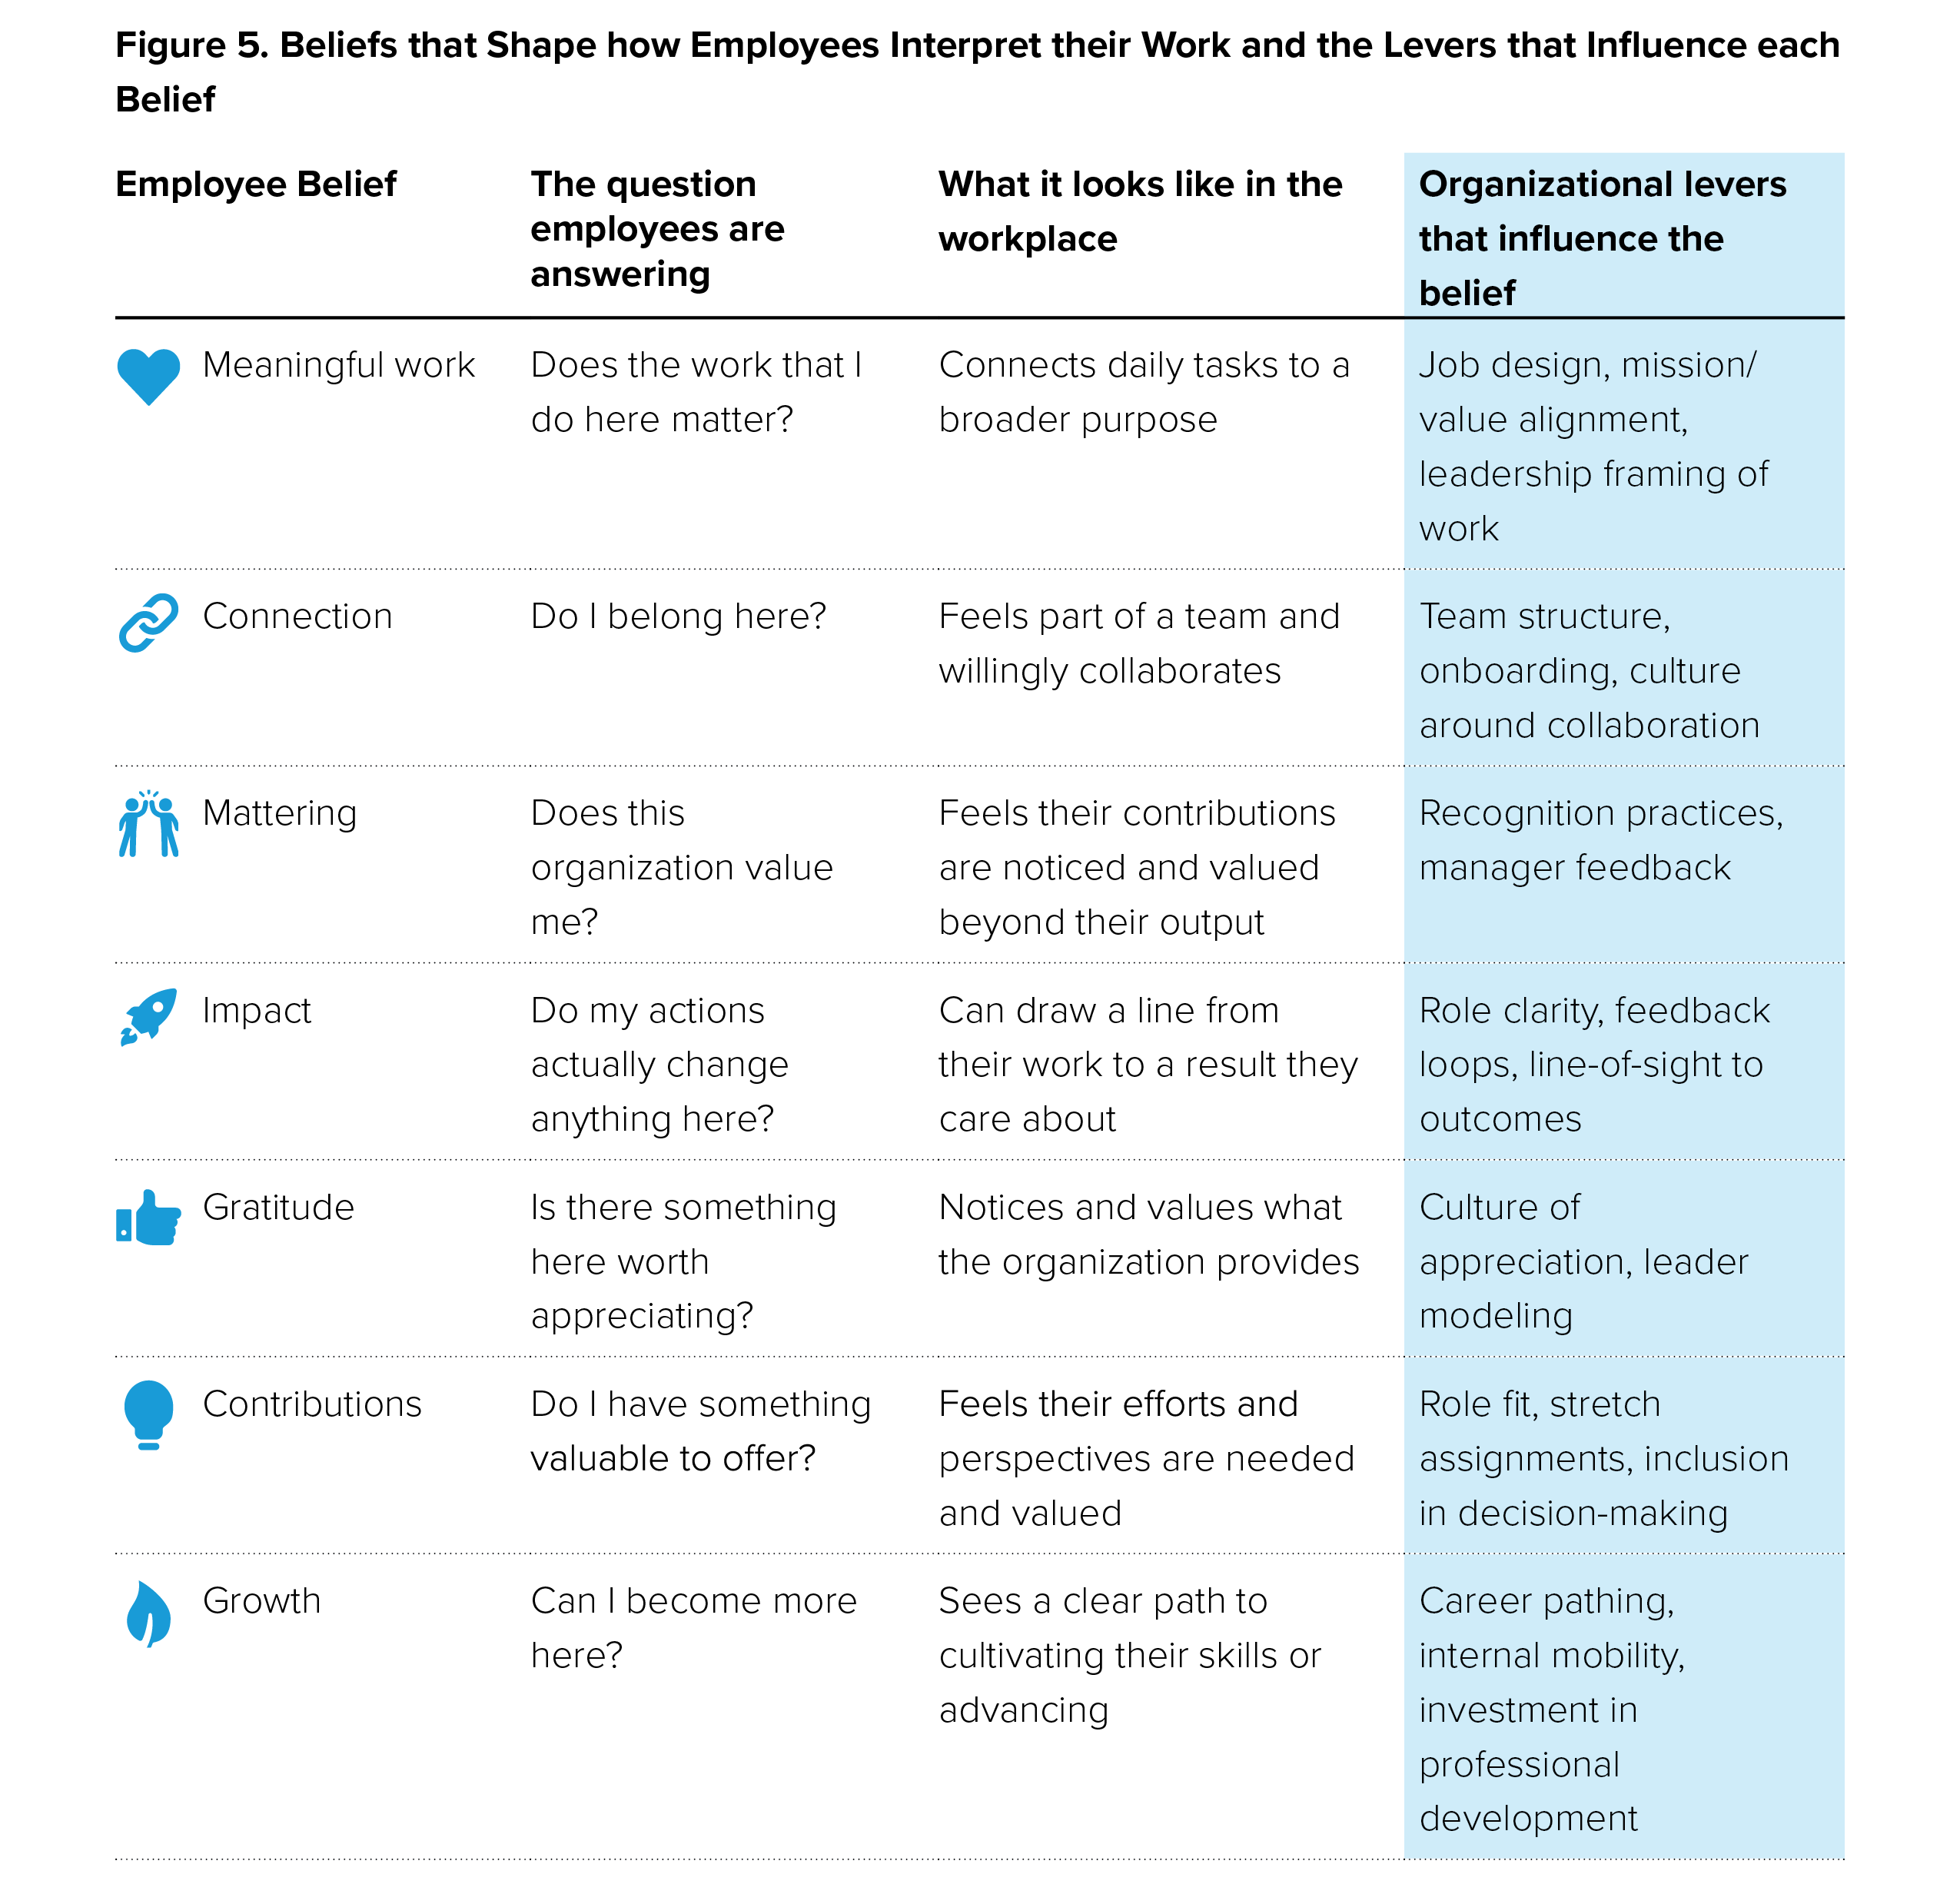
These beliefs are not fixed traits. They are shaped by organizational conditions and by how work is designed, how leaders communicate, how contributions are recognized, and how growth is made visible. Figure 5 maps each belief to the specific organizational levers that influence it, offering leaders a practical framework for identifying where the belief layer can benefit from targeted action to bolster it.
Methods
Data were collected via an online survey distributed across WorldatWork, International Thought Leader Network (ITLN), and The Human Resource Certification Institute (HRCI) databases from January 19, 2026 through February 25, 2026. A total of 1316 full responses were received. The margin of error for the completed sample is ±2.7% at the 95% confidence level. Because the survey allowed respondents to select multiple items on certain questions, reported sample sizes for individual items may exceed the total number of full responses. Data was analyzed through univariate, crosstabulation, and multivariate analyses.
Respondent Profile
A total of 1,316 full responses were received. Most respondents are middle-aged (45–64), female, and white, with a post-secondary education. Nearly three-quarters (72%) have been in their role for 2-5 years or more. Nearly all respondents are full-time employees (96%). Work arrangements are distributed across on-site (32%), hybrid (25%), and fully remote (21%). Individual contributors constitute the largest role group (n=500), followed closely by Senior Leadership (n=492) and Mid‑level Management (n=324).
The sample is predominantly drawn from Human Resources and People Operations (83%), with the most common specializations being Compensation and Salary Administration (27%), HR Generalist (20%), and Total Rewards Strategy (12%).
Organizational Overview
The sample represents a broad cross-section of organization types. There is a relatively even distribution of organization sizes, with most falling in the mid-size to large range (23% employ 1,000–4,999 workers) and only 9% representing the smallest organizations (1–49 employees). Forty percent are privately held, 22% are publicly traded, and more than a third (33%) operate in public and social services industries, including education, government, and healthcare. When asked about their organization's financial performance in 2025, responses followed a roughly normal distribution — a third said they did pretty well, while 21% said they just got by and another 21% said they did very well. On the HR front, 31% reported successfully launching a major HR initiative in the past year, 25% improved employee engagement or satisfaction scores, and 24% received positive recognition from leadership for HR performance.
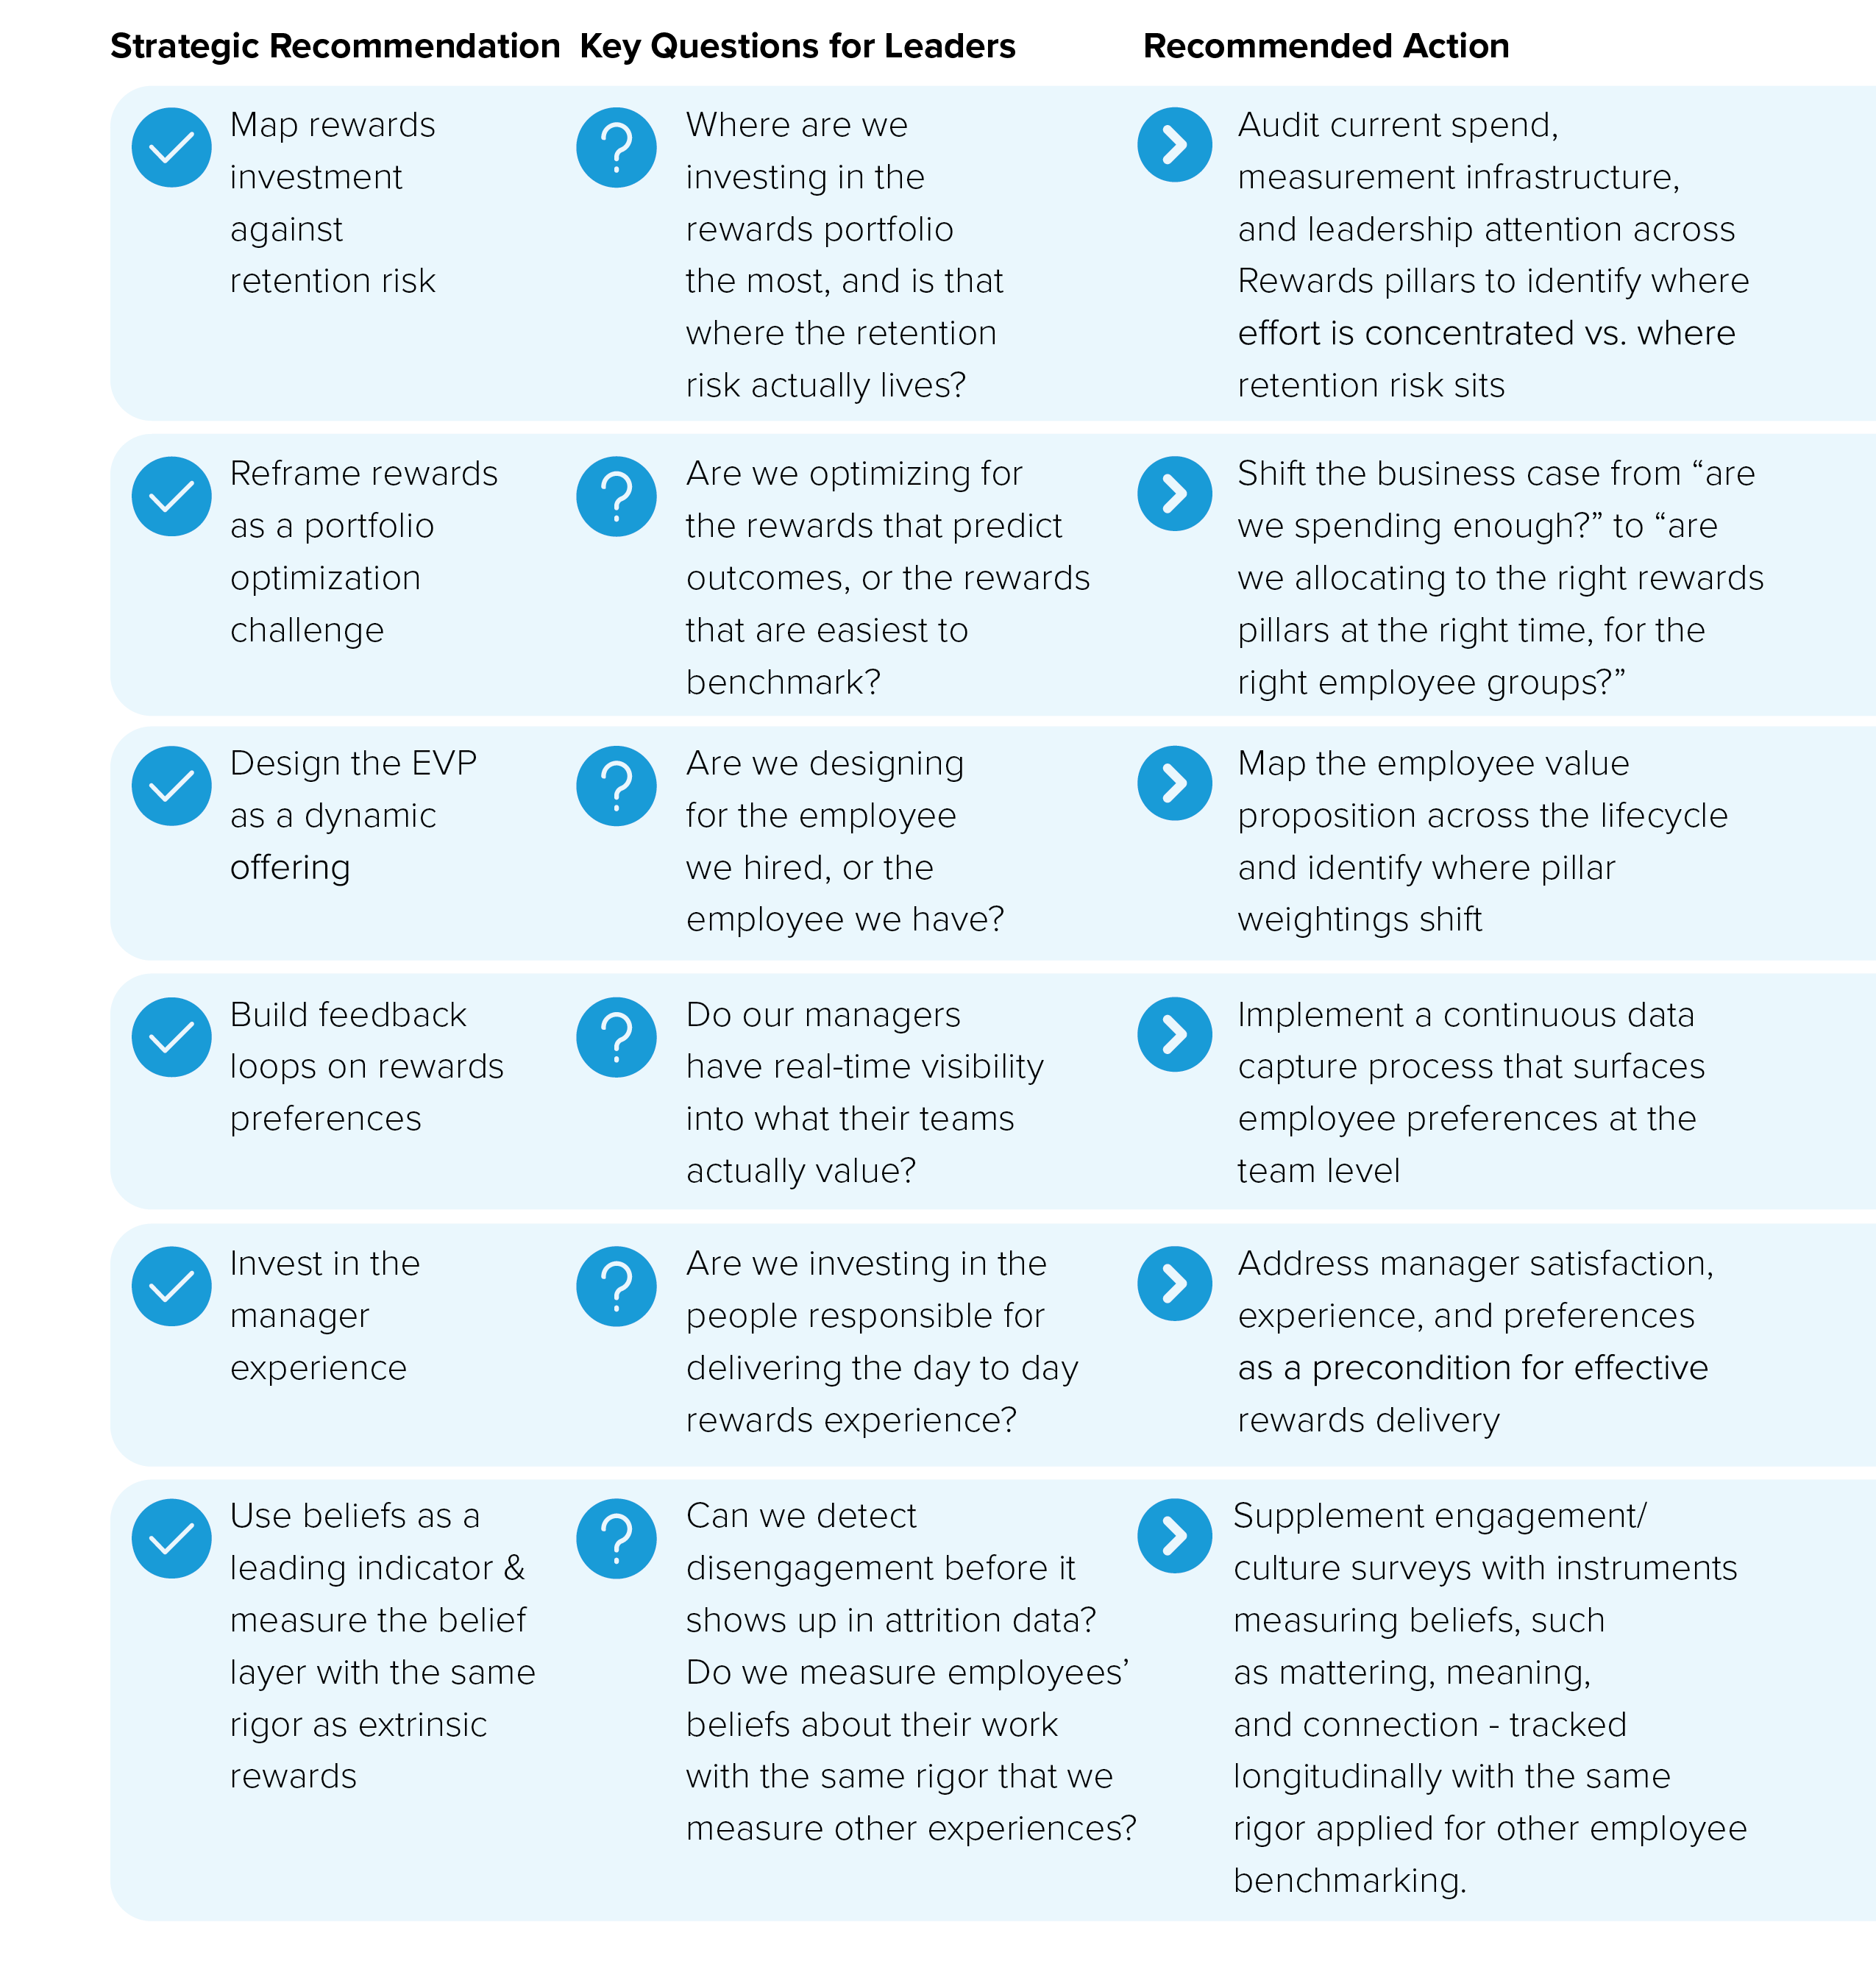
Strategic Recommendations for HR/Rewards Leaders
Our findings point to a critical misalignment: organizations are achieving higher satisfaction scores on the rewards pillars with the least predictive power, while the pillars that most strongly predict workforce outcomes (e.g., career development, well-being, and recognition) have lower satisfaction ratings.
For employees, the beliefs that they hold about their work and whether they find purpose in it, feel they matter, and see opportunities to grow, are instrumental in determining whether these rewards investments actually move the needle. The following recommendations offer leaders an actionable path to closing these gaps. When organizations align their rewards investments with how employees actually experience their work, they don’t just optimize workforce outcomes, but they bring work to life.
REFERENCES
- U.S. Bureau of Labor Statistics. (2026, February 11). Employment situation: Table 19—Industry employment and hours, seasonally adjusted. https://www.bls.gov/news.release/empsit.t19.htm#ces_table3.f.p
- WorldatWork (2025). Compensation programs and practices 2024. https://worldatwork.org/compensation-programs-practices-2027
- WorldatWork (2025). Total rewards inventory of programs & practices. https://worldatwork.org/research/total-rewards-inventory-of-programs-practices
- Gallup. (2026, January 28). U.S. employee engagement declines from 2020 peak. https://www.gallup.com/workplace/701486/employee-engagement-declines-2020-peak.aspx
- U.S. Bureau of Labor Statistics. (2026, March 13). Job openings and labor turnover—January 2026. https://www.bls.gov/news.release/pdf/jolts.pdf
- McKinsey & Company. (2023, September 11). Some employees are destroying value. Others are building it. Do you know the difference? https://www.mckinsey.com/capabilities/people-andorganizational-performance/our-insights/some-employees-are-destroying-value-others-are-buildingit-do-you-know-the-difference
- Gallup. (2024, January 23). In new workplace, U.S. employee engagement stagnates. https://www.gallup.com/workplace/608675/new-workplace-employee-engagement-stagnates.aspx
- Society for Human Resource Management. (2025, January 21). The myth of replaceability: Preparing for the loss of key employees. https://www.shrm.org/executive-network/insights/myth-replaceabilitypreparing-loss-key-employees
- Gallup. (2019, March 13). This fixable problem costs U.S. businesses $1 trillion. https://www.gallup.com/workplace/247391/fixable-problem-costs-businesses-trillion.aspx
- Work Institute. (2026). 2026 Retention Report. https://email.workinstitute.com/hubfs/2026%20Retention%20Report/WorkInstitute_RetentionReport_2026.pdf
- Gallup. (2024, December 3). The great detachment: Why employees feel stuck. https://www.gallup.com/workplace/653711/great-detachment-why-employees-feel-stuck.aspx
- Thier, J. (2024, November 24). 2025 is set to bring a “manager crash” as burnout and lack of support reach a breaking point. Fortune. https://fortune.com/2024/11/24/middle-manager-crash-2025-prediction-burnout/
- Perceptyx. (2024, June 25). 2024 Perceptyx benchmarks finds employee engagement back to normal—With one big exception. https://blog.perceptyx.com/2024-perceptyx-benchmarks-findsemployee-engagement-back-to-normal-with-one-big-exception
- Gallup. (2025). State of the global workplace: 2025 report. https://www.gallup.com/workplace/349484/state-of-the-global-workplace.aspx
- McKinsey & Company. (2023, March 10). Stop wasting your most precious resource: Middle managers. https://www.mckinsey.com/capabilities/people-and-organizational-performance/ourinsights/stop-wasting-your-most-precious-resource-middle-managers
- Baskin, K. (2023, June 13). To keep employees, focus on career advancement. MIT Sloan Management Review. https://mitsloan.mit.edu/ideas-made-to-matter/to-keep-employees-focuscareer-advancement
- LinkedIn Learning. (2025). Workplace learning report 2025. https://learning.linkedin.com/resources/workplace-learning-report
- Achor, S. (2012, January–February). Positive intelligence. Harvard Business Review. https://hbr.org/2012/01/positive-intelligence
- Achor, S. (2010). The happiness advantage: The seven principles of positive psychology that fuel success and performance at work. Crown Business.
- Achor, S. (2026). The Power of Beliefs: How Strengthening Seven Core Beliefs Predicts Greater Success and a Better Life. Crown Currency.


