
For WorldatWork Members
- Why Executive Compensation Is Following the Crowd and Why That Matters, Workspan Magazine article
- Compensation Structure Policies and Practices, research
- Compensation Committee Toolkit, tool
For Everyone
- What’s Topping Compensation Committee Agendas in 2025? Workspan Daily article
- Comparing Individual CEO Performance Against Corporate Results, Workspan Daily article
- Executive Decisions: Considering CEO Comp in Pre-Retirement Years, Workspan Daily article
- Essentials of Executive Compensation, course
High-performing organizations tend to set the bar for all others. In general, they perform well financially, attract and retain the best talent, and exhibit leading practices within the business as well as in their communities. Another way they stand out is through their executive pay programs.
WTW recently explored how “enduring high-performing companies” pay their executives. Our findings supported what we first discovered a decade ago: These companies follow a path less traveled.
Identifying Enduring High-Performing Companies
For this study, WTW defined “enduring high performers” (EHPs) as S&P 500 companies with total shareholder return (TSR) that outperformed the overall S&P 500 around 90% of the time in the past decade. Based on this criteria, we identified 39 EHPs, with the majority (82%) of them being in the financial, industrial and information technology sectors. The remaining 18% are in the consumer discretionary, consumer stables, healthcare and materials sectors.
Our references to “the broader market,” “market” or “other companies” refer to all other S&P 500 companies, excluding EHPs. Target-pay mix and long-term performance award payouts are based on CEOs in place for three full years.
How EHPs Differentiate Their Executive Pay Programs
When WTW first reviewed EHP executive pay programs in 2014, we found that EHPs:
- Have certain fundamental executive pay program features in common with the broader market, such as targeting overall pay opportunities at the 50th percentile, while allowing performance to drive executives’ realizable and earned pay; and,
- Differentiate their programs to double-down on aligning executives’ realizable and earned pay with higher growth and stronger performance.
Our most recent research confirmed EHPs continue with that same approach. The next few sections speak to elements of that strategy.
Incentive Compensation Leverage
EHPs leverage incentive compensation to provide for greater risk and reward potential via a greater emphasis on performance-based pay and more upside and downside potential in incentive payout curves. In EHPs, CEOs’ target total direct compensation comprises a higher portion in short-term incentives (STI) plus long-term incentives (LTI) than in the broader market (Figure 1).
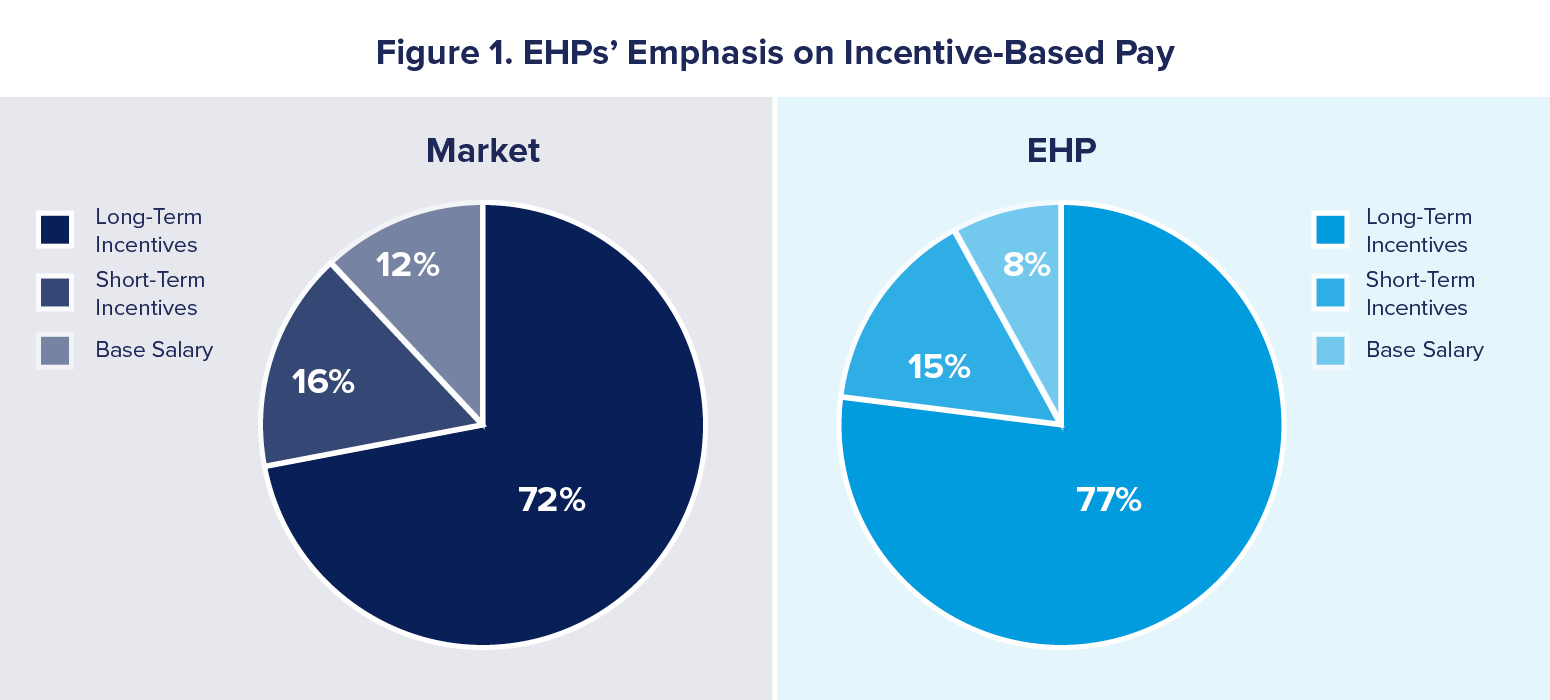
Source: WTW Global Executive Compensation Analysis Team 2024 analysis
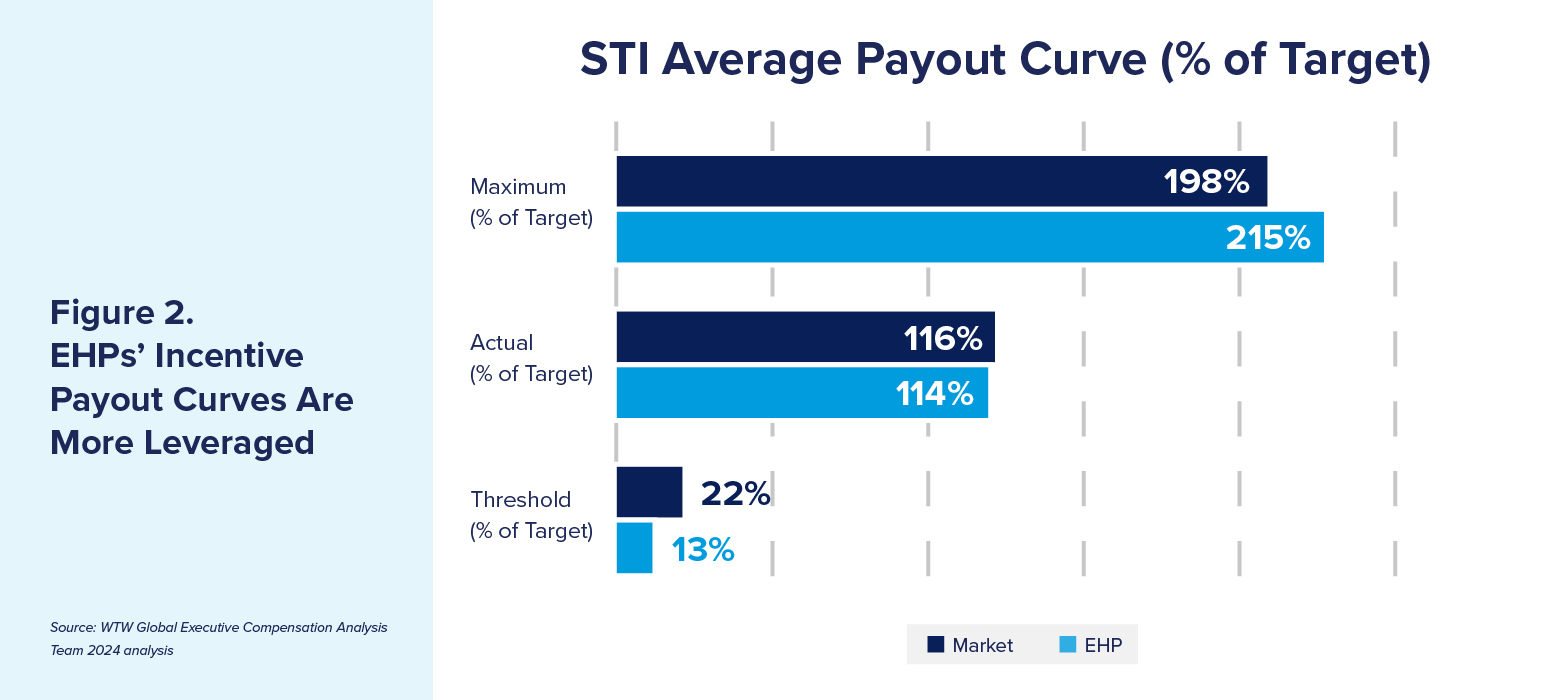
Additionally, EHPs provide more leveraged incentive payout opportunities. For example, the average STI maximum payout as a percentage of target award is 198% in the broad market, whereas the average maximum payout among EHPs is 215%. At the bottom of payout curves, the broad-market STI threshold payout is, on average, 22% of target, while the average EHP STI threshold payout is just 13% (Figure 2).
Although EHP target incentive award levels are only moderately higher, their strong performance, including stock price appreciation, results in significantly higher realizable pay. For long-term performance plans (LTPPs), EHPs’ payout as a percentage of target is 200% at the 75th percentile vs. 173% in the broader market, and EHPs’ realizable payout is 305% at the 75th percentile vs. 220% in the broader market (Figure 3).
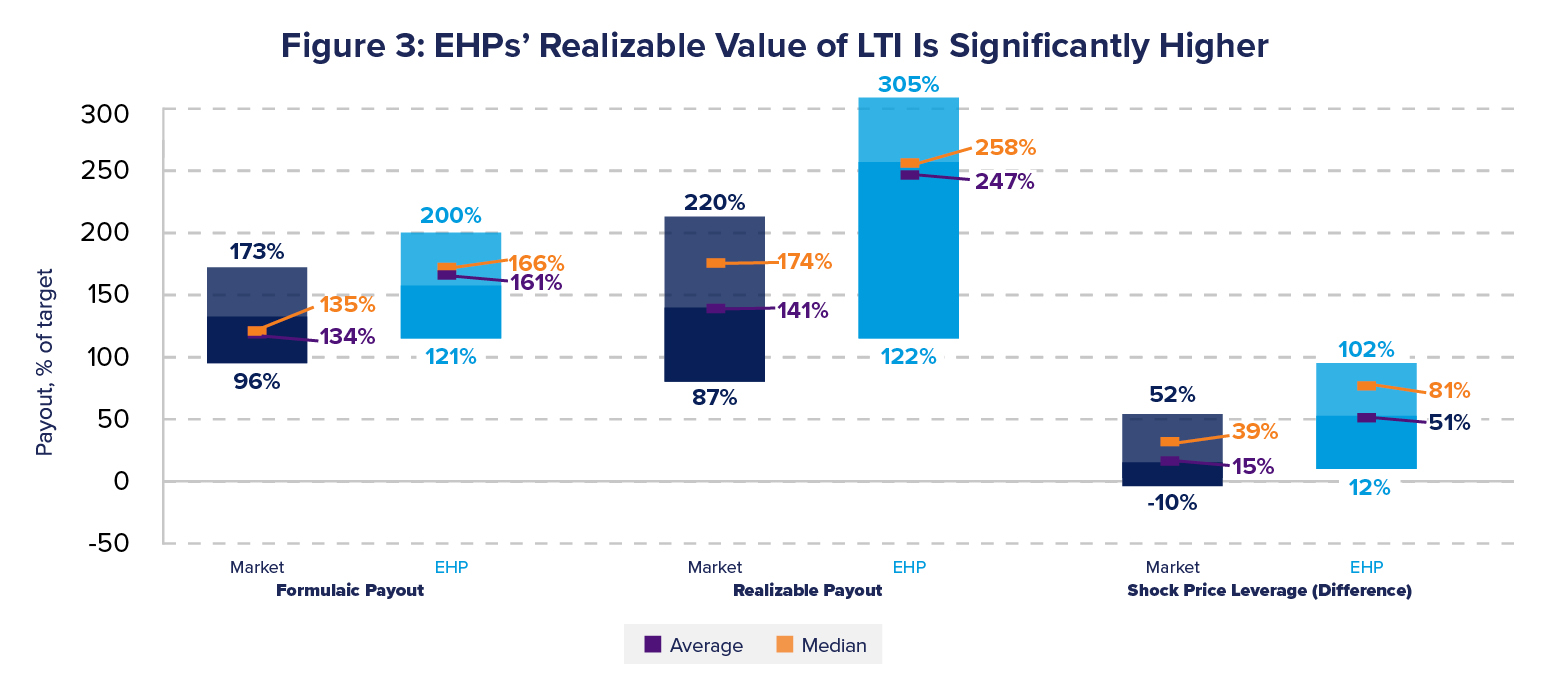
Source: WTW Global Executive Compensation Analysis Team 2024 analysis
Finite Metric Focus
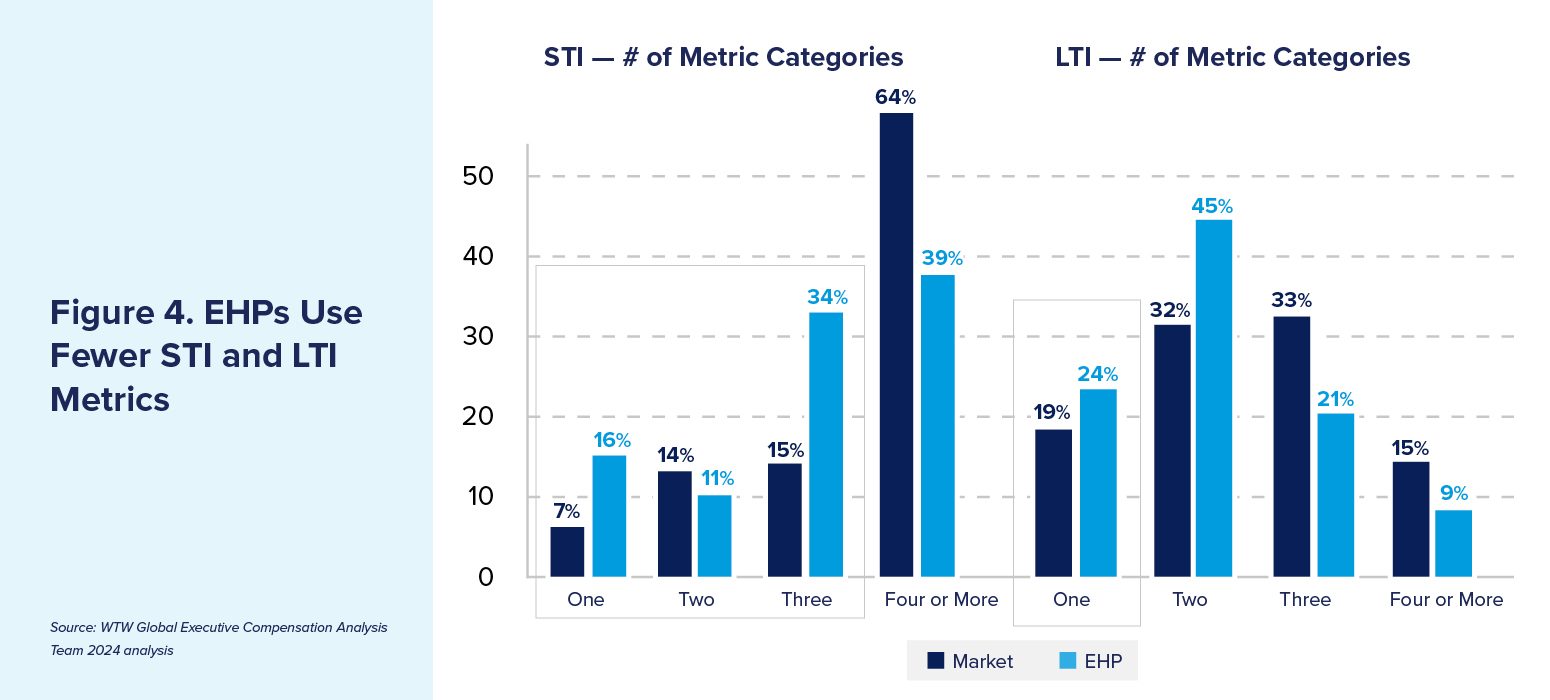
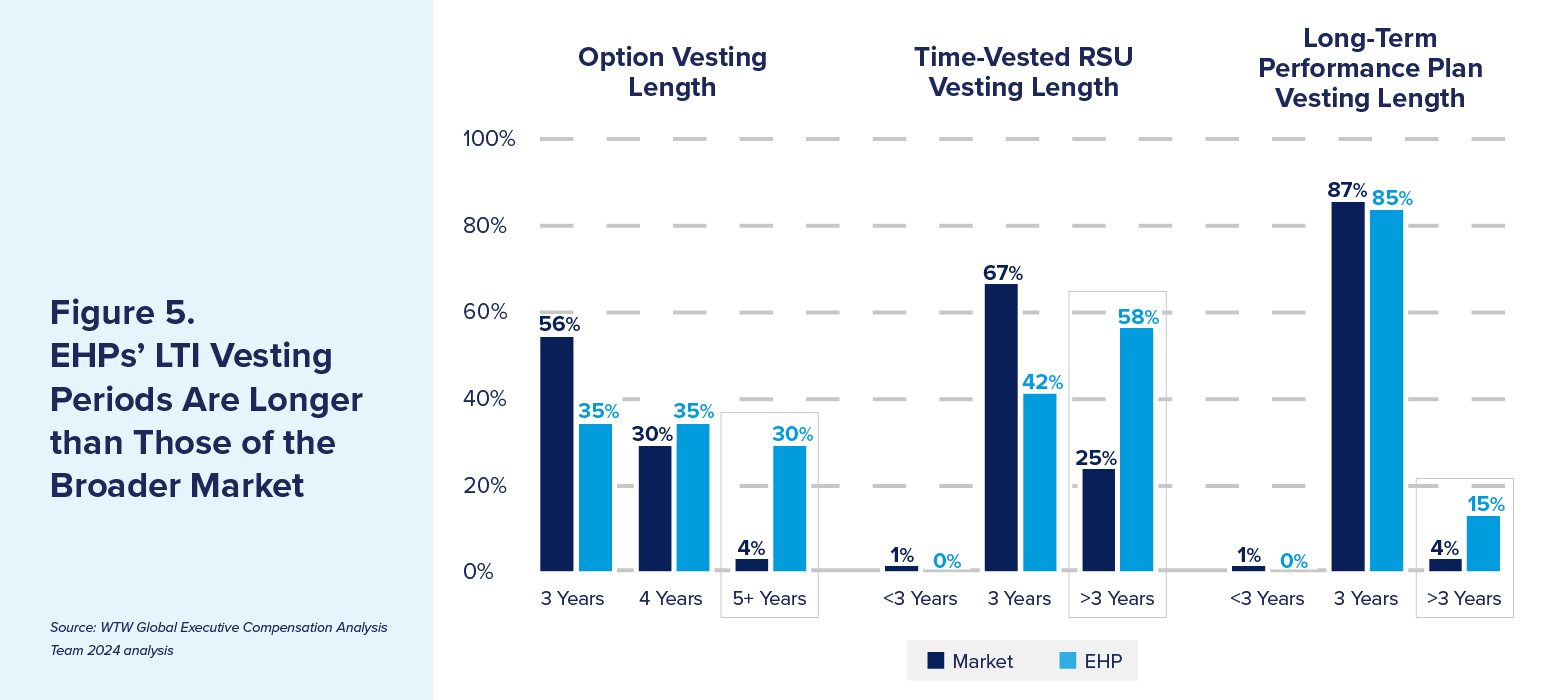
EHPs seek focus by using fewer performance metrics and tend to encourage a longer-term perspective through longer LTI vesting. Whereas the number of STI metrics in the broad market is typically four or more, EHPs tend to use three or fewer STI metrics. Likewise, nearly half of companies in the broad market use three or more metrics for LTPPs, while nearly half of EHPs use two metrics and about one-quarter use just one metric (Figure 4).
EHPs also maintain longer LTI vesting periods for time-vested restricted shares/units (RSUs) (Figure 5).
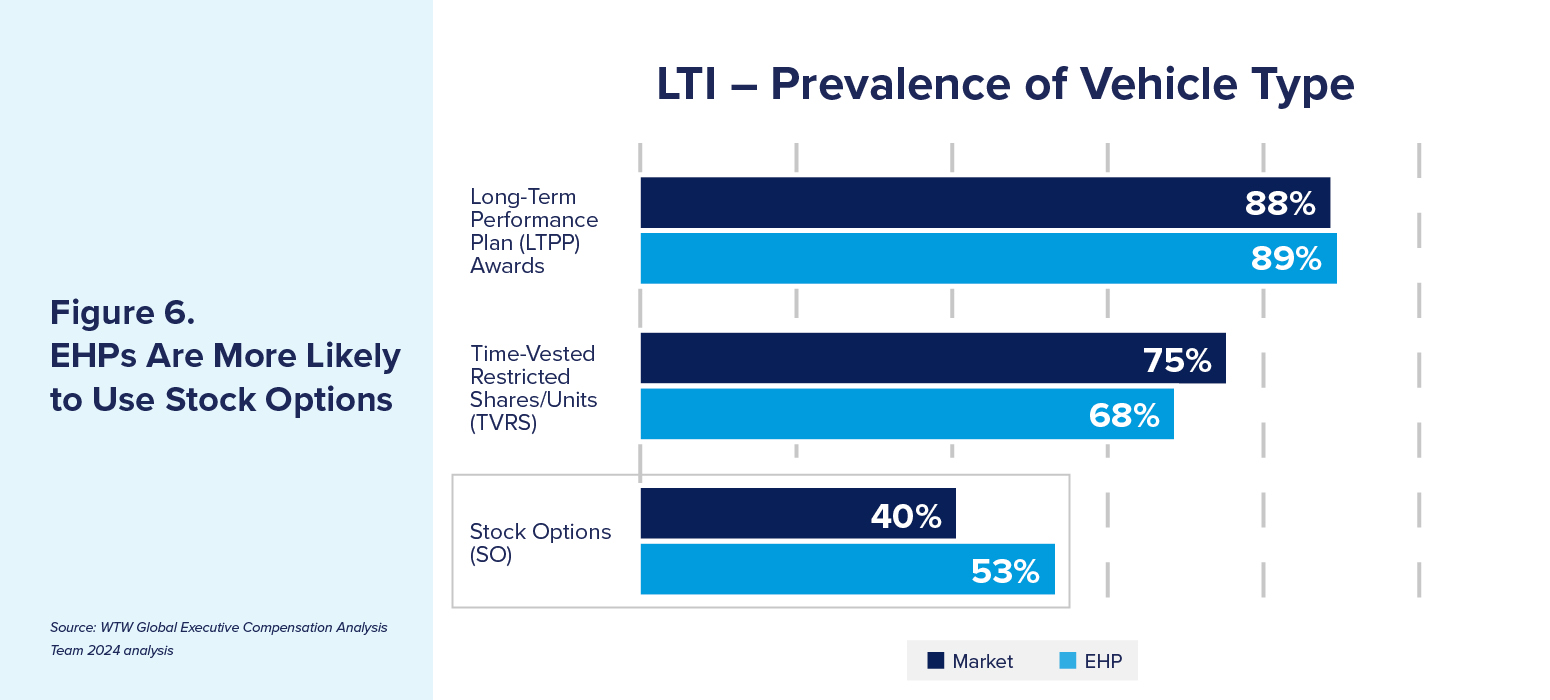
LTI Stock Option Emphasis
For LTIs, EHPs apply greater emphasis on stock price appreciation by being more likely to use stock options. While the prevalence of time-vested RSUs is lower among EHPs (68%) than other companies (75%), more EHPs (53%) use stock options than other companies (40%) (Figure 6).
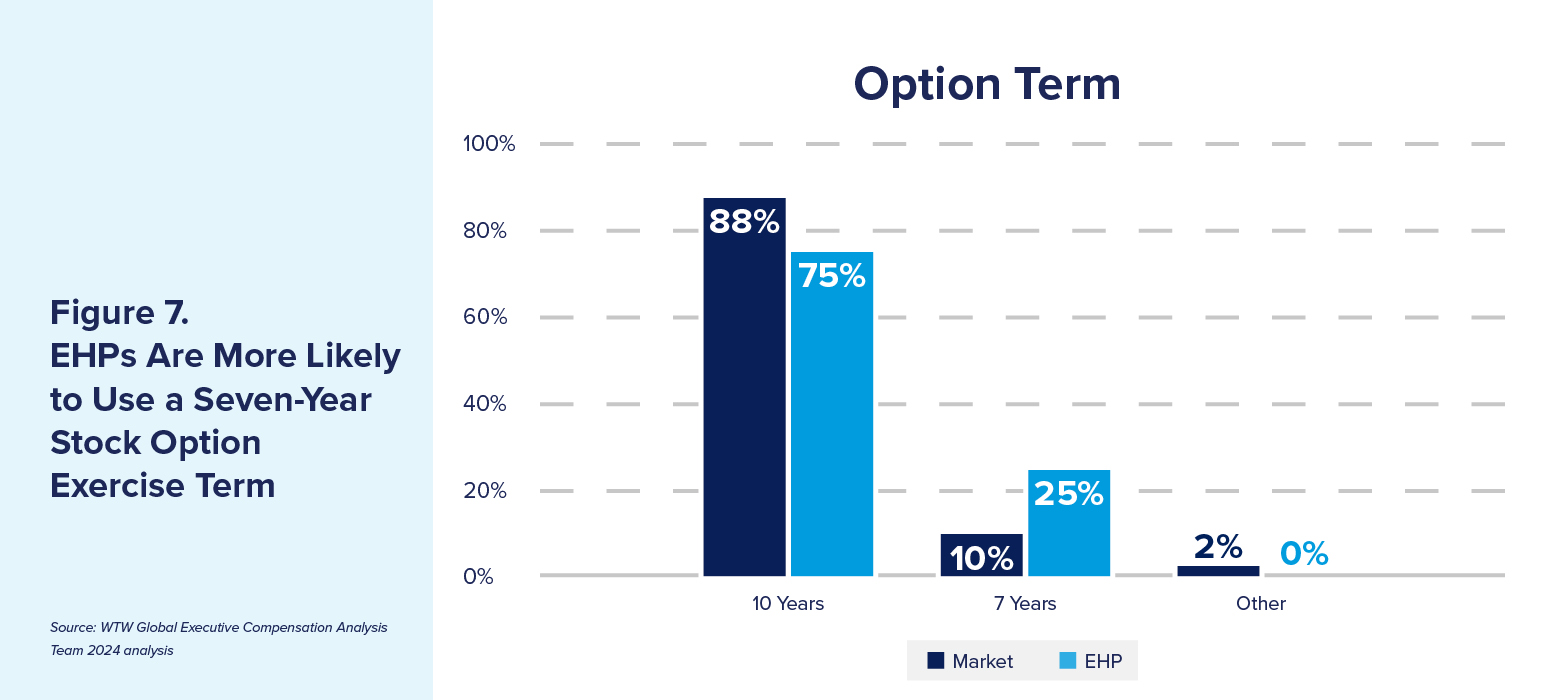
We also observed that, while both EHPs and other companies typically grant stock options with a 10-year term, EHPs are more likely to use a seven-year term (Figure 7).
Best Fit Matters Most
The close mirroring of these latest findings against our 2014 analysis indicates these strategies are effective for EHPs given their profile and common characteristics (e.g., high growth, consistently strong financial performance). Although EHP practices are not market practices and they do not represent leading practice for all companies, they are best fit for those companies. What might you do with this information?
1. Consider lessons learned from EHPs’ playbook.
Challenge yourself with questions such as:
- Could we reduce our number of performance metrics across both STI and LTI to optimize focus on what truly matters to strategy execution and value creation?
- Should we revisit our performance ranges and recalibrate our payout opportunities?
- Is our LTI vesting cycle sufficiently long?
- Could stock options (or another form of share-appreciation LTI) make sense as we expect renewed growth?
The answer to each could be “no” or “not now,” but asking these questions can be beneficial toward ensuring the pay program evolves in step with your organization’s strategy and performance journey.
2. Resist the temptation to mirror market practice or perceived leading practices.
Market practice often can be misconstrued as “best” (or leading) practice. Because your organization competes under its unique service and/or product proposition, your executive pay program and performance measurement framework should support your organization’s strategic pillars and stakeholder interests. Don’t mimic what competitors do without adequate assessment.
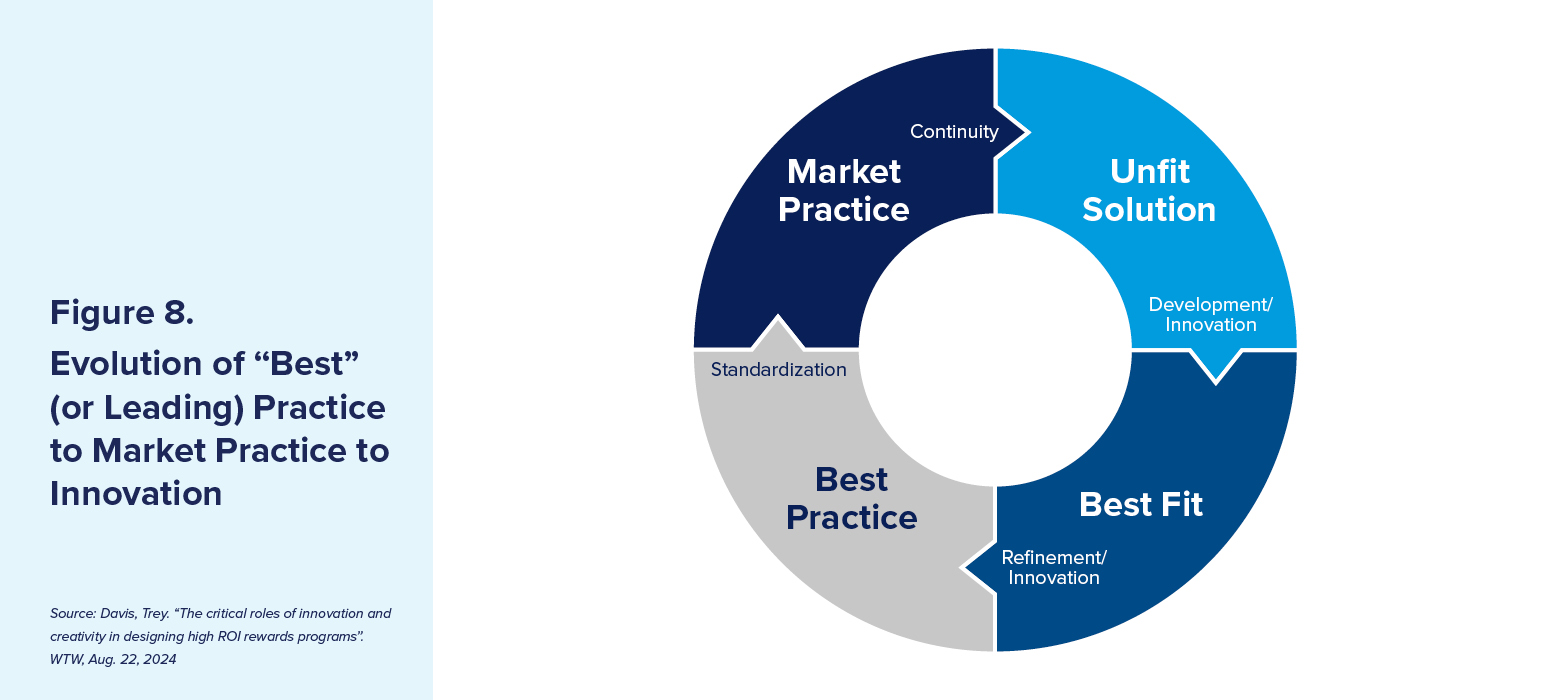
3. Generate innovative solutions that represent best fit for your organization.
Evidence supports the idea that when best-fit solutions are generated, stakeholders have provided permission to adopt them. Challenge conventional wisdom and be bold and innovative for your organization (Figure 8).
Looking to high-performing organizations is a good place to begin when thinking about your approach to executive pay programs. However, it is critical to also keep your organization’s unique strategy, lifecycle stage, culture and objectives top of mind when considering your path forward. Assessing what will be best fit and relevant to your executives against both EHP practices and market practices is a step in the right direction.
Editor’s Note: Additional Content
For more information and resources related to this article, see the pages below, which offer quick access to all WorldatWork content on these topics: