
For WorldatWork Members
- Five Thought Leaders Dive Deeper into Executive Compensation Issues, Journal of Total Rewards article
- Compensation Structure Policies and Practices, research
- Compensation Committee Toolkit, tool
For Everyone
- What’s Topping Compensation Committee Agendas in 2025? Workspan Daily article
- Consider Performance Targets for Setting Executive Incentive Goals, Workspan Daily article
- Are DEI Metrics in Executive Incentive Plans Gone for Good? Workspan Daily article
- Comparing Individual CEO Performance Against Corporate Results, Workspan Daily article
- Executive Compensation Immersion Program, course
Setting financial incentive goals is one of the most complex executive compensation challenges faced by compensation committees and management teams. Striking the right balance between challenge and attainability is critical for driving engagement, performance and long-term shareholder value creation.
This article builds on “historical payouts,” one of the factors WTW executive compensation leader Zach Georgeson considered in his Workspan Daily article on a framework for effective goal setting. Specifically, it examines whether S&P 1500 CEO annual incentive payouts align with commonly cited statistics around payout distribution. It also explores whether organizations should universally calibrate incentive goals to a bell-shaped distribution or if variations based on their unique compensation strategy are more appropriate.
The Merits of Bell-Shaped Distribution
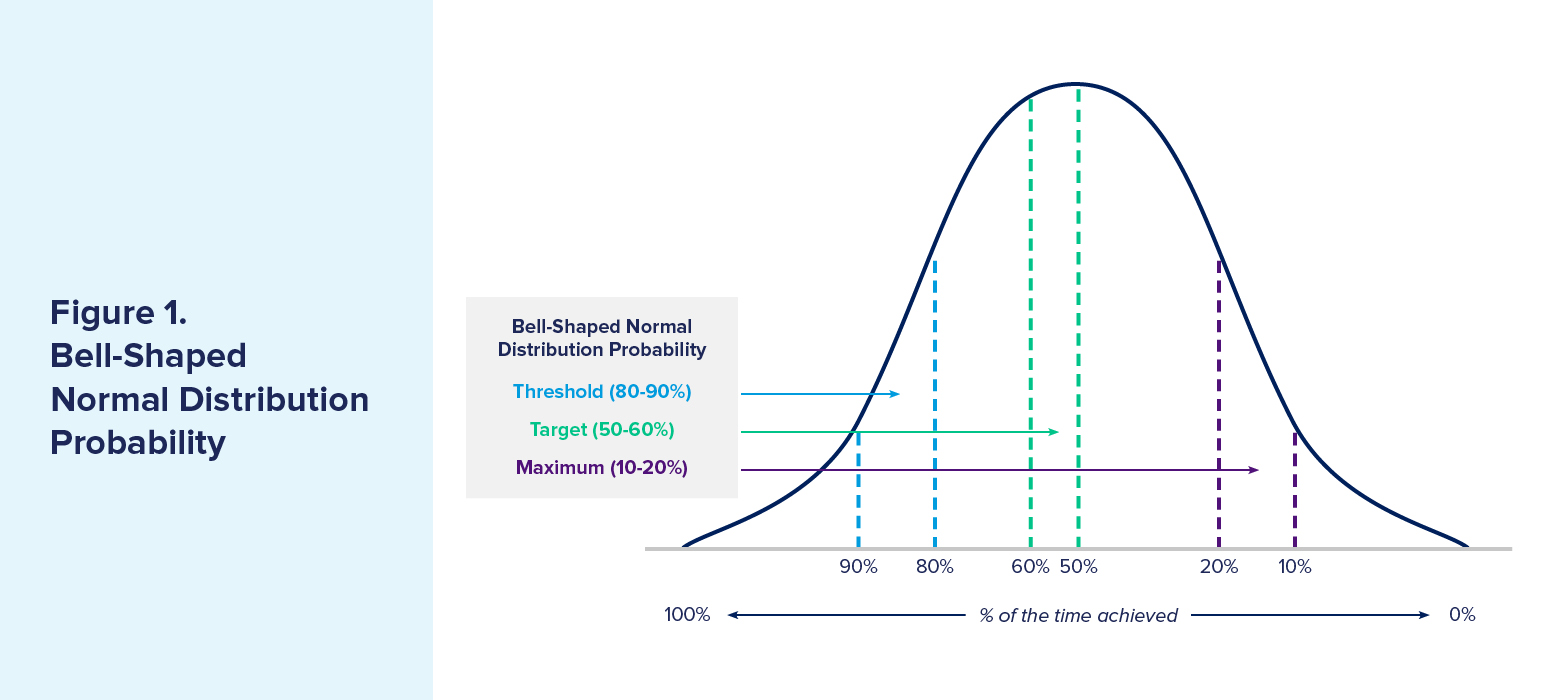
Discussions around incentive plan calibration typically center on three key performance levels: threshold, target and maximum. A widely accepted rule of thumb suggests the probability of achieving these levels should follow a structured pattern (see Figure 1 below):
- Threshold goal (80% to 90% probability). The minimum acceptable level of performance to ensure some payouts; there should be no payout below that threshold.
- Target goal (50% to 50% probability). The expected outcome, achievable in most business cycles.
- Maximum goal (10% to 20% probability). Achieved in only one or two years out of 10, representing an exceptional level of performance
This probability-based approach increasing the likelihood that goals (i.e., threshold, target, maximum) are challenging yet attainable. Proper calibration helps avoid two significant risks:
- Setting goals too low (sandbagging). Overly easy goals can result in excessive payouts for underperformance, misaligning executive incentives with shareholder interests.
- Setting goals too aggressively. Unattainable goals can demotivate executives, leading to increased turnover and driving excessive risk-taking in pursuit of unrealistic targets.
Using a bell-shaped distribution model, organizations can balance motivation and risk management, better ensuring that incentives reward strong performance without encouraging reckless decision-making.
Testing the Probability-Based Model
WTW analyzed 10 years of CEO annual incentive payouts across the S&P 1500 to validate this framework. Figure 2 plots a cumulative distribution graph, which reflects how often annual incentive payouts exceed a certain percentage of target.
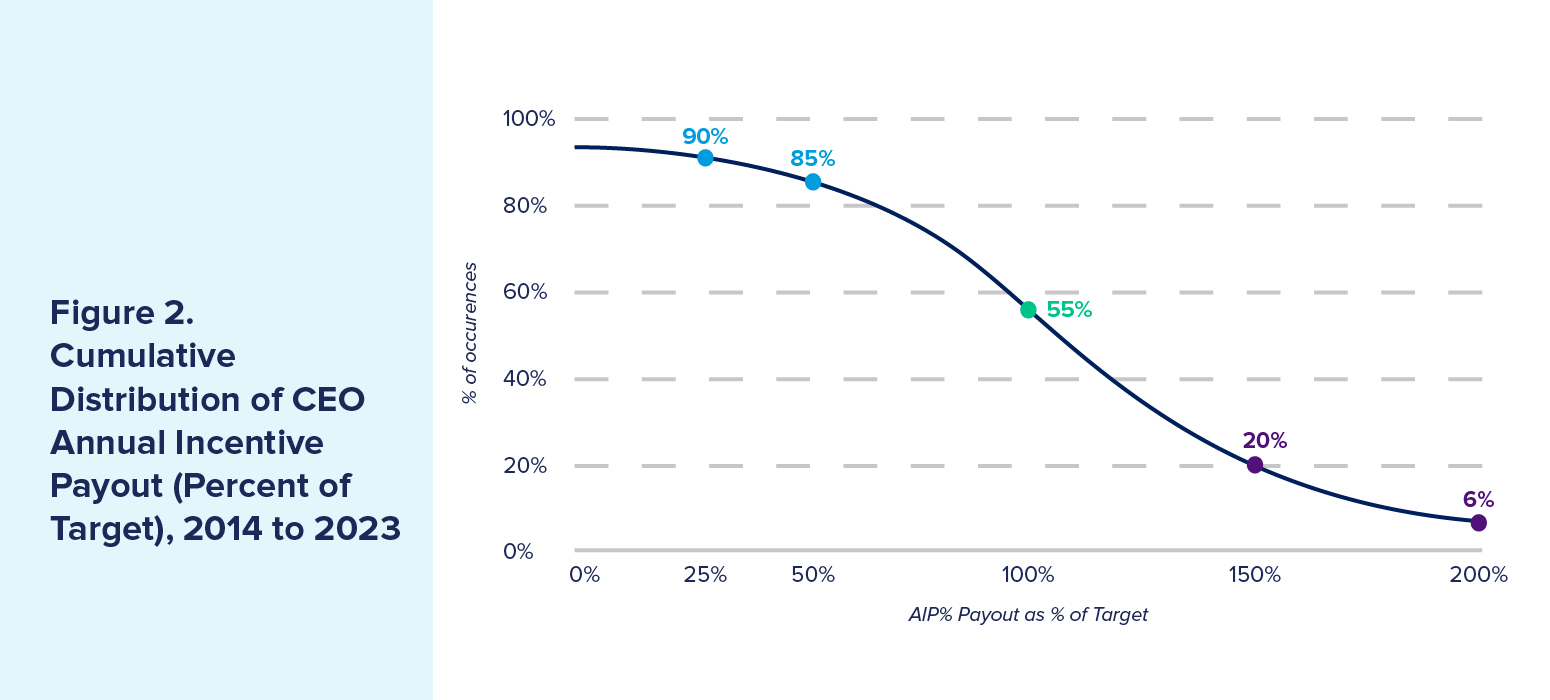
The findings closely aligned with the expected probability ranges:
- Threshold payout (25% to 50% of target). Achieved 90% to 85% of the time.
- Target payout (100% of target). Achieved 55% of the time.
- Maximum payout (150% to 200% of target). Achieved between 6% and 20% of the time.
These findings also closely aligned with the anticipated probabilities: 80% to 90% for threshold; 50% to 60% for target; and 10% to 20% for maximum performance. Even after excluding 2020 and 2021 — years with pandemic-related anomalies — the results were consistent, further reinforcing the model’s validity.
These findings suggest that many organizations naturally align with the normal curve, whether by design or as an outcome of their financial planning processes.
Some Caveats Based on Organizational Uniqueness
Should all organizations align incentive goals to a normal distribution? The short answer: Not necessarily.
While the normal curve serves as a useful guideline, organizations should consider their unique compensation strategy when calibrating goals rather than blindly adhering to a fixed distribution model. Compensation strategies vary based on corporate culture, risk appetite, industry, operational objectives and business maturity. For example:
- High-risk, high-reward cultures may prefer setting aspirational goals, leading to greater swings in annual incentive payouts with more frequent zero or maximum payouts. This structure rewards breakthrough performance and offers more significant upside potential.
- Risk-averse or more mature organizations may favor payout stability, limiting extreme downside and upside scenarios to reduce excessive risk-taking and support executive retention.
Ultimately, the key question is: Does your particular strategy prioritize stable payouts with minimal variance or a higher-risk, higher-reward structure with more volatility? Your answer should align with the organization’s long-term strategic plan and risk tolerance.
Does Your Payout Curve Reflect Your Strategy?
Consider an organization with an earnings per share (EPS) growth goal and an asymmetric payout curve, offering a steeper slope (and, therefore, bigger rewards) for outperformance than penalizing for underperformance (see Figure 3).
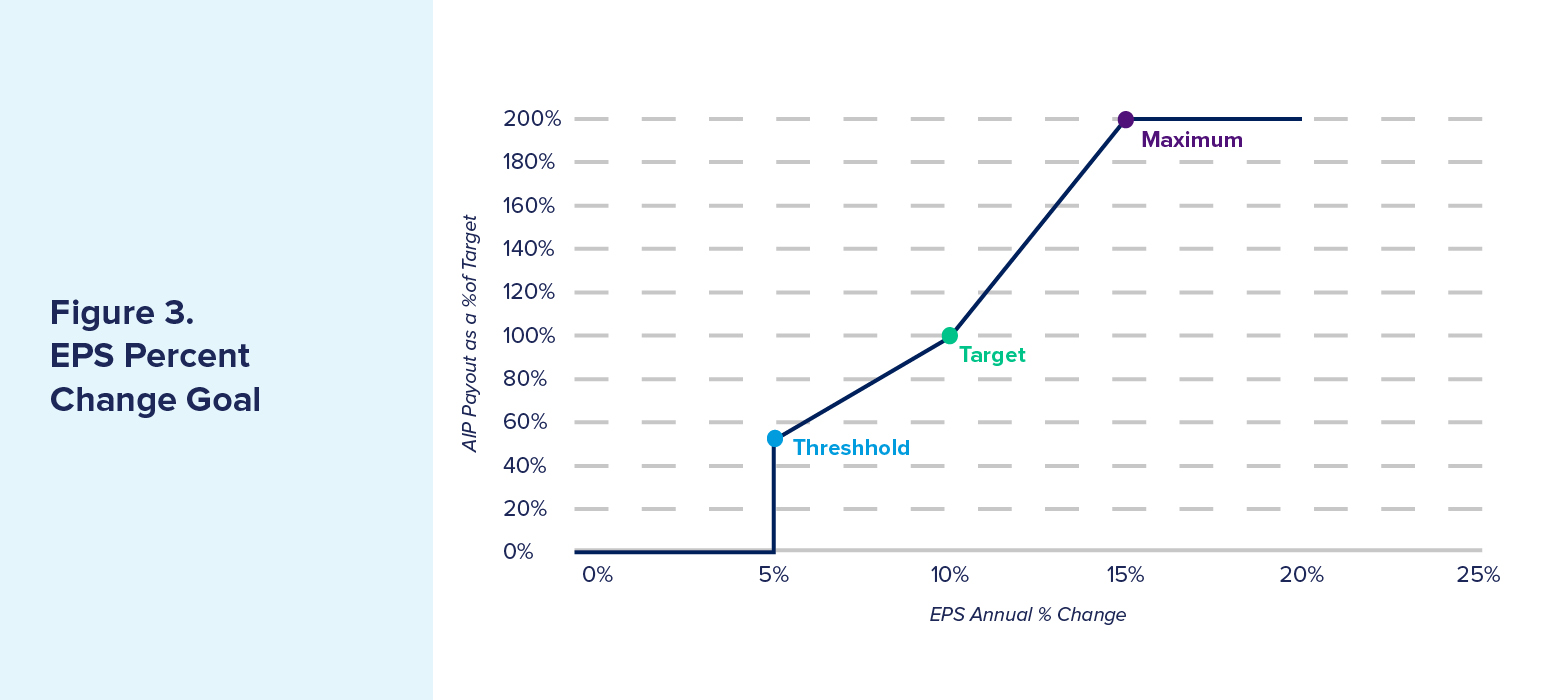
How do you determine if this structure is appropriate? WTW recommends evaluating past payout distributions against actual performance results:
- Historical payout patterns. How often have you hit threshold, target and maximum in the past 10 years? Do actual payouts match the intended probability distribution? How stretched should the maximum goals be compared to target?
- Forecasting accuracy. How well does the organization predict its financial performance?
- Industry cyclicality. Are external factors (e.g., economic cycles) driving volatility more than internal performance?
The figure below reflects an example of EPS performance over the course of 10 years.
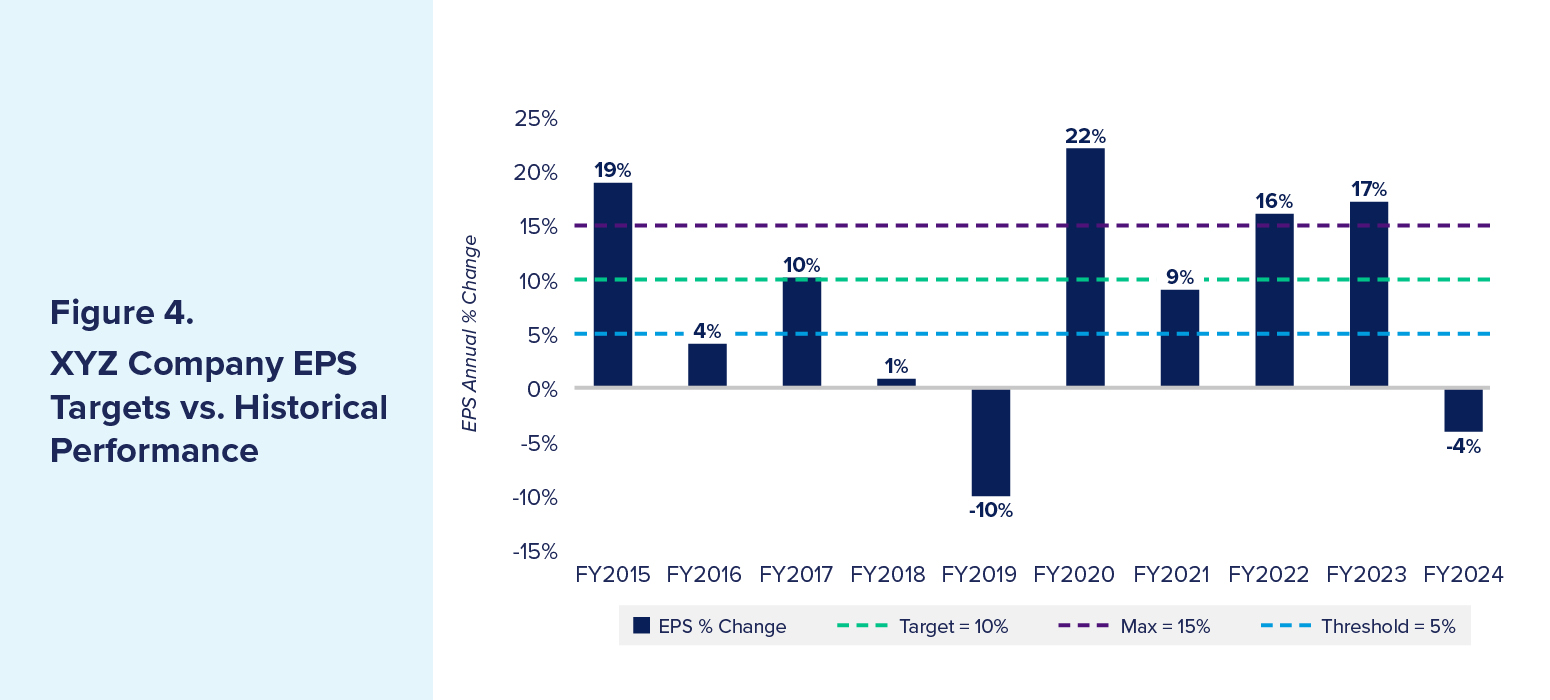
As the data shows, for this company, threshold was achieved six times, target five times and maximum four times in the past decade. What are the takeaways?
- This payout pattern suggests extreme outcomes (both low and high payouts) are more frequent than normal distribution would predict.
- However, if the company’s pay philosophy encourages ambitious goal-setting and embraces volatility, this approach may be appropriate.
- Conversely, if the organization intends to provide stable, predictable compensation, it may need to adjust its goal-setting framework to reduce variability.
Blending Data and Strategy in Goal-Setting
Goal setting in executive incentive plans is both an art and a science. While a probability-based approach provides a structured framework, it should be tailored to each organization’s strategy, culture and risk tolerance.
For this reason, consider reviewing the other inputs from Georgeson’s article: balancing internal data (e.g., budgets, forecasts, long-term strategies) with external benchmarks (e.g., peer performance, analyst/market expectations).
By analyzing historical payouts, benchmarking against normal distribution models and aligning with long-term business objectives, organizations can design effective executive incentive plans that drive performance, manage risk and sustain engagement.
Editor’s Note: Additional Content
For more information and resources related to this article, see the pages below, which offer quick access to all WorldatWork content on these topics: