
For WorldatWork Members
- Compensation Structure Policies and Practices, research
- Compensation Committee Toolkit, tool
- Why Executive Compensation Is Following the Crowd and Why That Matters, Workspan Magazine article
For Everyone
- Should Your CEO Incentive Payouts Follow a Bell-Shaped Curve? Workspan Daily article
- What’s Topping Compensation Committee Agendas in 2025? Workspan Daily article
- Consider Performance Targets for Setting Executive Incentive Goals, Workspan Daily article
- Are DEI Metrics in Executive Incentive Plans Gone for Good? Workspan Daily article
As organizations enter the second half of the decade, executive compensation appears to be settling into a new equilibrium — one shaped by years of pandemic-era disruption, evolving investor expectations, and a shifting macroeconomic and geopolitical landscape.
The WTW Global Executive Compensation Analytics Team (GECAT) analyzed CEO pay trends across the S&P 1500. The findings suggest that, while target total direct compensation (TTDC) growth has slowed, the design and delivery of incentive pay are becoming more nuanced — and, in some cases, more complex — in response to continued volatility and companies seeking to attract, retain and incentivize top-tier talent.
Normalization in Pay Growth Signals Market Stability
In an era marked by unprecedented disruption, it is likely crucial for organizations to remain agile, ensuring their incentive structures are robust enough to withstand unforeseen challenges and align closely with their long-term business strategies. As shown in Figure 1, 2024 marked the lowest annual increase in TTDC for CEOs since 2020.
Figure 1: Five-Year S&P 1500 CEO Pay Trends
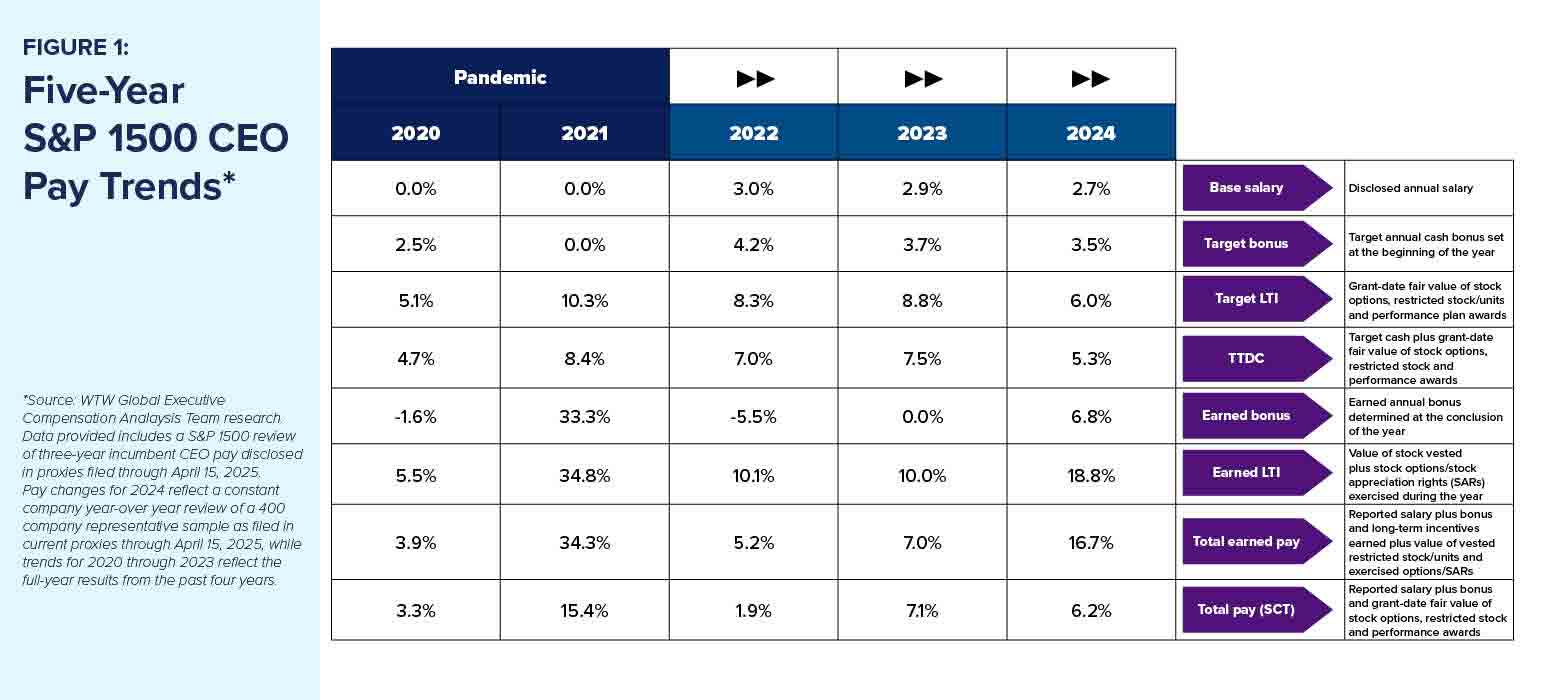
The return to more normalized long-term incentive (LTI) growth levels in 2024 also reflects greater confidence in business fundamentals. The spike in fair value equity grants observed during the pandemic has receded, suggesting boards are less reliant on retention-driven pay adjustments and are focusing instead on addressing issues through core program design refinements. When navigating the complexities of an ever-evolving market landscape, the necessity for adaptive and resilient compensation programs becomes increasingly clear.
Payout Outcomes Reflect Strength and Volatility
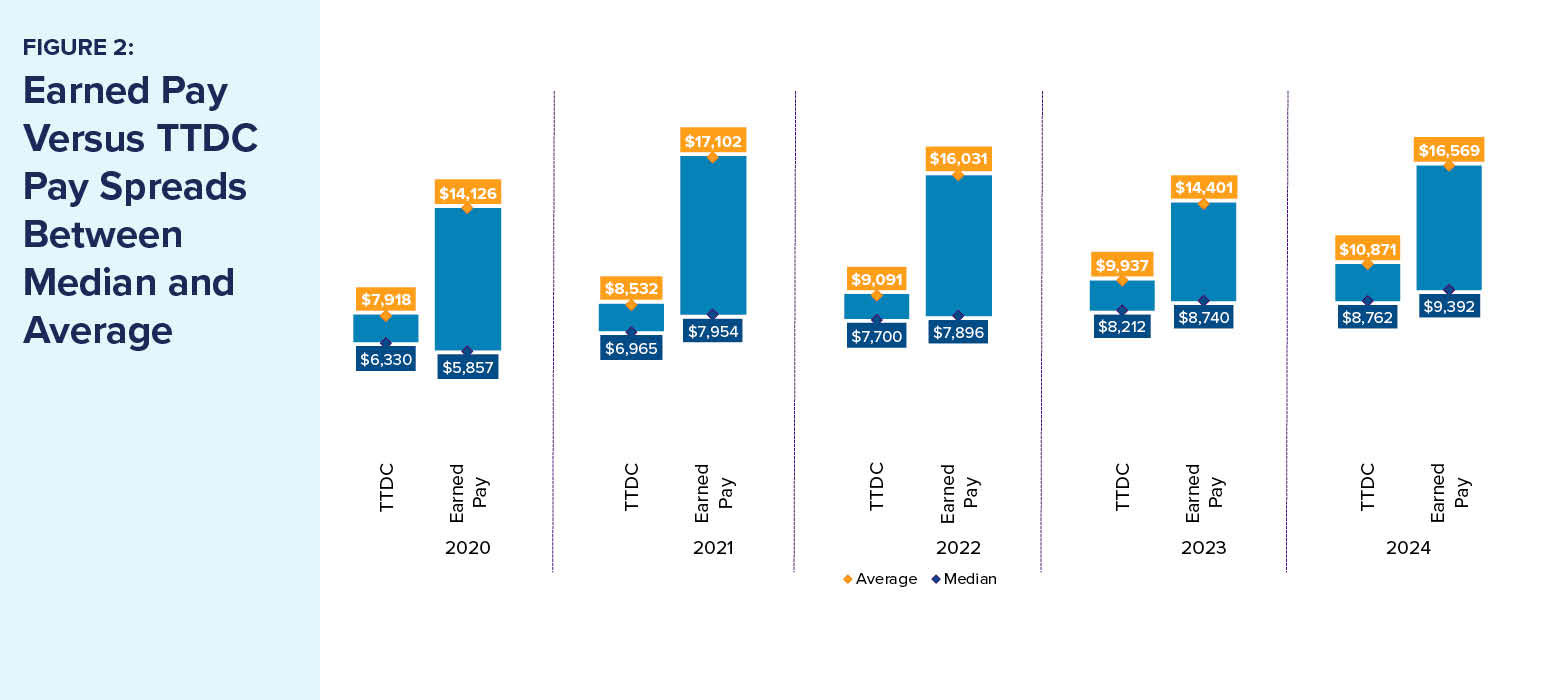
While target pay growth may have leveled off, actual pay outcomes in 2024 tell a more nuanced story. Earned pay rose 17% at the median — a meaningful increase buoyed by earned incentive growth. Much of this can be attributed to strong payouts under long-term performance plans, many of which captured performance measured from 2022 to 2024, a period of significant market recovery.
However, this upward trend in realized pay also underscores the impact of outliers and volatility across the executive population. As shown in Figure 2, the spread between median and average earned pay is consistently wider than what we’ve seen compared to TTDC, reflecting the influence of program design, market timing, stock price sensitivity and broader performance dispersion across sectors.
Figure 2: Spread Between Median and Average of Earned Pay and TTDC
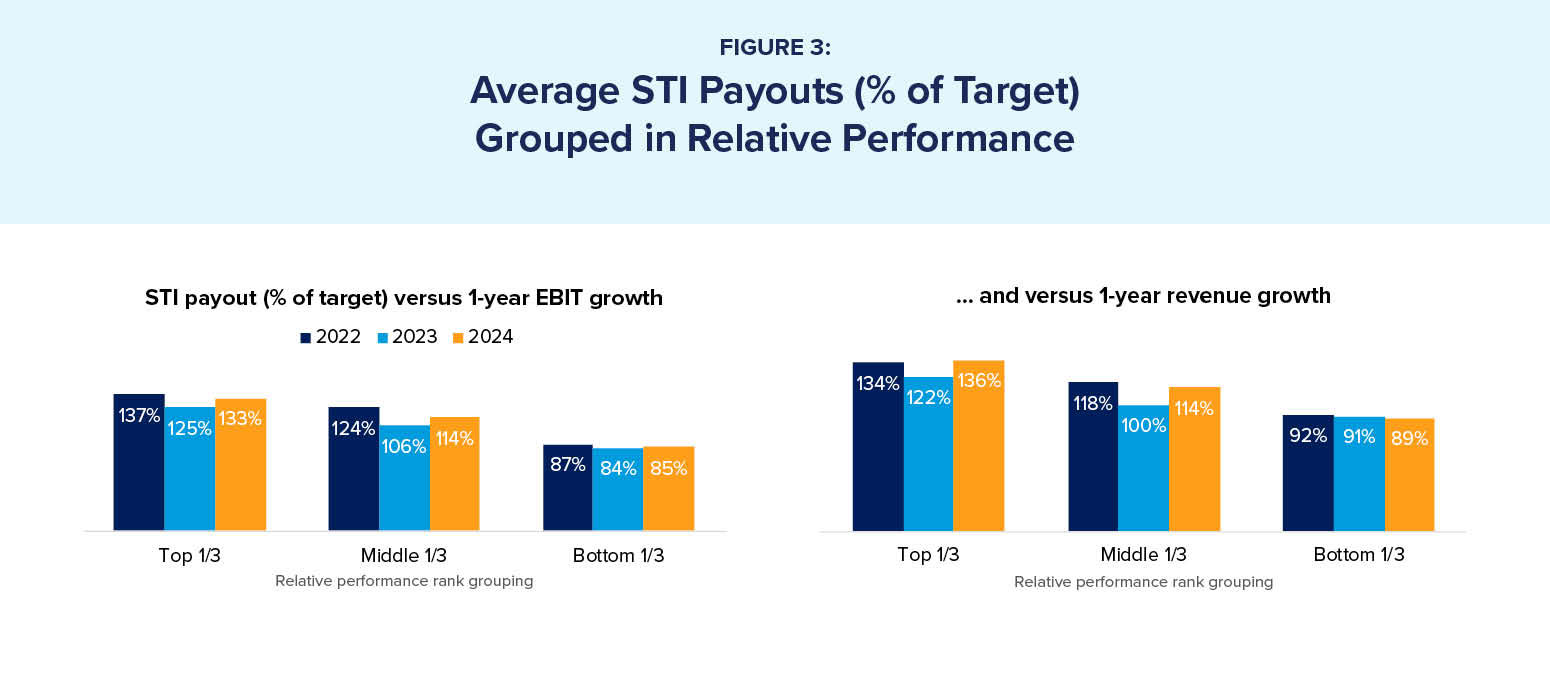
Earned short-term incentives (STIs) were similarly strong, with 2024 representing the highest change in year-over-year growth (6.8%), outside of the exceptional spike noted in 2021. More notably, Figure 3 shows payout distributions as a percentage of target aligns closely with the bucketed rankings of one-year company performance against proxies for the most prevalent financial metrics.
Figure 3: Average STI Payouts (% of Target) Grouped in Relative Performance Buckets
More Metrics and Performance Optimization
One of the clearest trends emerging from the data is the steady increase in design complexity. Nearly 60% of companies now incorporate more than three metrics in their annual bonus plans — up 7 percentage points from five years ago. The two most common financial metrics, operating income (at 65%) and revenue growth (at 48%) are incrementally becoming more prevalent, while environmental, social and governance (ESG) usage grew 23 percentage points to 57% in 2024. Speaking to the evolution in ESG metric usage, there has been a 5-percentage-point increase in quantitative measurement, and a corresponding decrease in qualitative measurement, since 2020, with up to 57% of the companies using weighted ESG metrics.
On the LTI side, complexity also is on the rise. Use of multiple performance metrics is becoming the norm, and the role of absolute total shareholder return (TSR) is expanding. Five years ago, only 18% of companies used absolute TSR — and most did so as a modifier. In 2024, nearly a quarter of companies use it, and the majority now treat absolute TSR as a standalone weighted metric, underscoring its perceived materiality in long-term value creation. More than two-thirds of companies (68%) with long-term performance awards are using either absolute or relative (64%) TSR, while 20% are using both.
These changes signify a broader commitment to shifting toward selecting and calibrating performance precision tailored to specific needs and guided by market best practices. Boards are refining their metric frameworks not just to respond to external pressure, but to better capture how value is created and preserved over time. For example, we’ve noted that across the current sample of companies, revenue has increased nearly 40% and market capitalization has increased 83%, on average, since 2020, aligning with the increased reliance on revenue and TSR metrics over the same time.
Macroeconomic Headwinds Raise the Stakes
It’s important to interpret these trends in context. 2024 unfolded against a backdrop of renewed geopolitical tension, uncertainty around global tariffs, and ongoing volatility in currency exchange rates and supply chain conditions. These forces complicate performance measurement and increase the pressure on boards to balance flexibility with clarity in executive pay programs.
We also observed the material impact of market timing on the value of earned equity awards. In 2024, shifts in equity value around specific geopolitical announcements — including new tariff policy — created meaningful variation in realized compensation, even where performance targets were met. This underscores the importance of transparent communication and robust plan design in preserving both internal motivation and external credibility, as we explored in this series of articles on goal-setting and historic payout distributions.
Looking Ahead: Precision Without Overreach
With the 2025 cycle already under way, companies are shifting from reacting to external shocks to thoughtfully embedding flexibility into incentive design. While we don’t expect a wholesale retreat from ESG or TSR-based metrics, we do expect to see more rigorous alignment of those measures with business strategy — and, potentially, more scrutiny over how these metrics are communicated to investors.
Executive pay is stabilizing but not stagnating. Boards and compensation committees are navigating a complex environment with more data, expectations and tools at their disposal. Success will likely depend not just on the right mix of pay elements, but on the clarity, intentionality and adaptability of the compensation and benefit architecture behind them.
Editor’s Note: Additional Content
For more information and resources related to this article, see the pages below, which offer quick access to all WorldatWork content on these topics: